 1 hour ago
1
1 hour ago
1
XRP has broken below the key psychological and technical support level of $1.30. Following a period of distribution throughout May, the token faces heightened selling pressure at the beginning of June.
The technical breakdown coincides with scheduled network updates and localized supply expansions, forcing traders to re-evaluate near-term downside risks and potential reversal areas.
XRP Price Prediction: Downside Acceleration and Key Targets
The 4-hour XRP/USD chart shows a definitive breakdown from a descending triangle structure. The descending yellow trendline has consistently suppressed attempted relief rallies since mid-May, capping higher bounds and compressing price action into horizontal support.
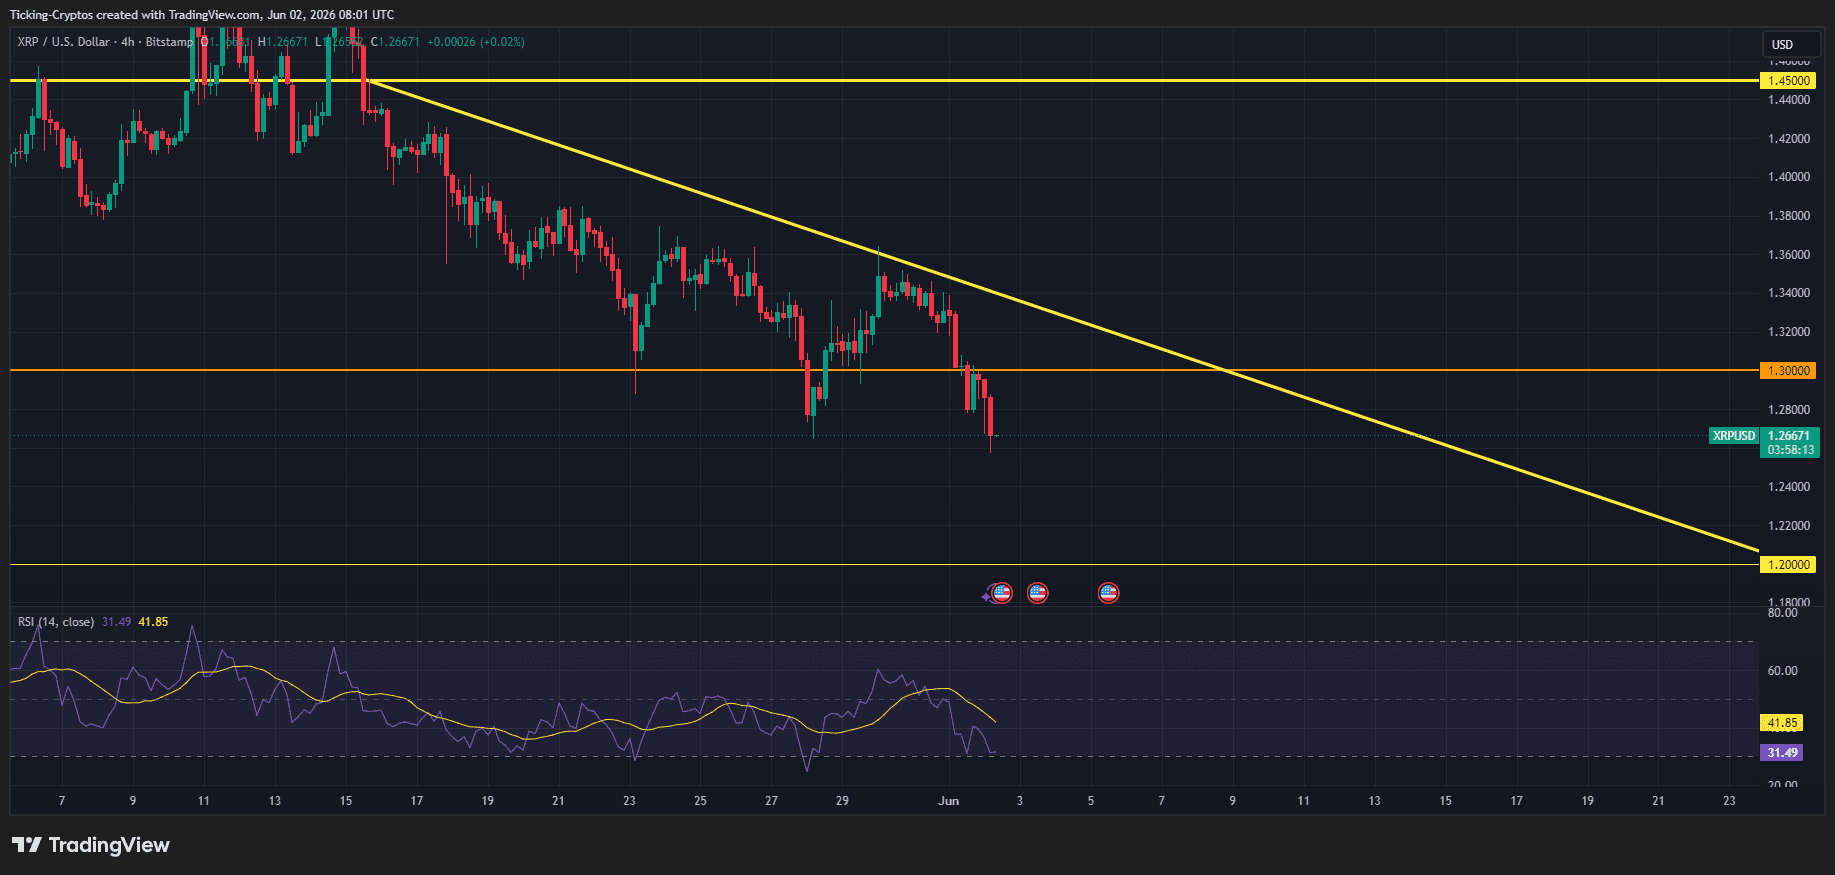
Downside Targets (Support Levels)
- $1.20 Zone: This is the immediate and most critical macro support level on the chart. If selling pressure continues to accelerate, the $1.20 mark serves as the primary defensive floor where historical demand has previously emerged.
- Below $1.20: A failure to hold the $1.20 horizontal boundary could open the door for a deeper correction toward the psychological $1.00 handle, though options market pricing currently assigns a low probability to an immediate sub-dollar drop.
Upside Targets (Resistance Levels)
- $1.30 (The Broken Pivot): The former support level at $1.30 now flips into immediate overhead resistance. XRP must reclaim this level on decisive volume to invalidate the current bearish bias.
- $1.45 Boundary: Marked by the solid horizontal line and the origination point of the current descending trendline, the $1.45 price point remains the definitive barrier holding back structural macro bullish momentum.
Macro Drag: Bitcoin Slides to $70K and Rattles Market Risk
Exacerbating XRP's structural weakness is a sharp decline in Bitcoin ($BTC), which has fallen below the critical $70,000 threshold for the first time since April. The market bellwether faced a sudden wave of liquidations following an SEC filing by its largest corporate holder, Strategy (formerly MicroStrategy), disclosing a rare sale of tokens to fulfill dividend obligations. Though the sale amount was nominal, it shattered the "never selling" narrative and induced widespread FUD across institutional channels.
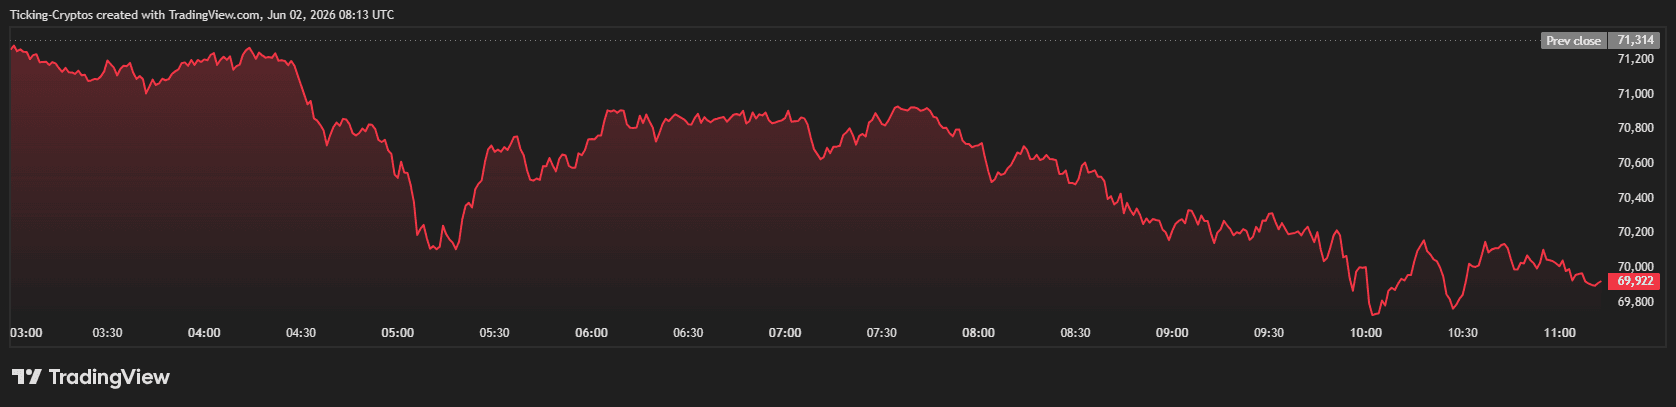 BTC Price in USD today
This corporate selling pressure has coupled with persistent macroeconomic headwinds reported on Forbes, including massive capital outflows from spot Bitcoin ETFs as investors rotate capital into safer equity sectors like artificial intelligence. Furthermore, escalating geopolitical friction in the Middle East has quashed general risk appetite. Because $Bitcoin dictates systemic crypto market correlation, its ongoing battle to maintain the $70,000 floor introduces a severe risk outlook for altcoins. If BTC breaks decisively lower toward $60,000, it will likely drag XRP and the wider market down into a prolonged capitulation phase.
Fundamental Drivers: Why is XRP Price Down?
The immediate trigger for the increased liquid supply comes alongside Ripple’s standard monthly operations. According to on-chain tracking data compiled, Ripple executed its scheduled escrow unlock on June 1, releasing 1 billion $XRP across three separate transactions.
While the majority of these monthly distributions are historically returned to locked escrow accounts to manage long-term supply inflation, the structural introduction of liquidity often creates short-term headwind pressures when broader market sentiment remains risk-off.
Despite the localized price correction, structural indicators show underlying capital rotation into the XRP ecosystem. Following the definitive settlement of the Ripple vs. SEC lawsuit in late 2025, systemic regulatory risks have largely abated. This institutional shift has fostered continuous inflows into regulated spot exchange-traded funds (ETFs) and expansion protocols like the RLUSD stablecoin framework, establishing a fundamental divergence between short-term technical volatility and long-term network utility.


 English (US) ·