Bitcoin bulls managed to defend the $66K support level as the leading crypto asset reversed part of its strong gains yesterday that was partly fueled by a strong uptick in ETF inflows.
Summary
- Bitcoin price rebounded from above $66,000 support as its ETFs resumed an inflow trend.
- A bearish flag pattern has formed on the daily chart.
According to data from crypto.news, Bitcoin (BTC) price surged nearly 7% to roughly $70,000 on Thursday as investor sentiment for risk assets was boosted following the release of a bullish Nvidia earnings report that triggered a surge in tech stocks.
Rising equity prices often act as a catalyst for a risk-on rotation. As market confidence strengthens, capital flows out of defensive positions and into high-beta sectors like cryptocurrency.
The bellwether’s rally was also supported by a strong demand seen from institutional investors for spot Bitcoin ETFs. Data from SoSoValue shows that the 12 U.S. spot Bitcoin ETFs drew in $506 million in net inflows on Feb. 25, nearly double the figure recorded the prior day.
Shortly after its $70K rally, Bitcoin price had retraced nearly 4% to $66,641. This selloff was accompanied by a 2% drop in Nasdaq as investors booked profits after the stock’s notable run higher into the earnings event. The drawdown created a cooling effect across the broader financial landscape.
Bitcoin has since bounced back above $67,500 after bulls lodged another attempt to reclaim the $70K threshold. The momentum was supported by the $254 million inflows recorded by spot BTC ETFs on Thursday.
Despite today’s bounce, some analysts believe Bitcoin could continue its larger downtrend that began in early January before any meaningful trend reversal takes shape.
According to analyst Ted Pillows, Bitcoin price appears to be forming a recurring fractal pattern that has historically preceded downturns.
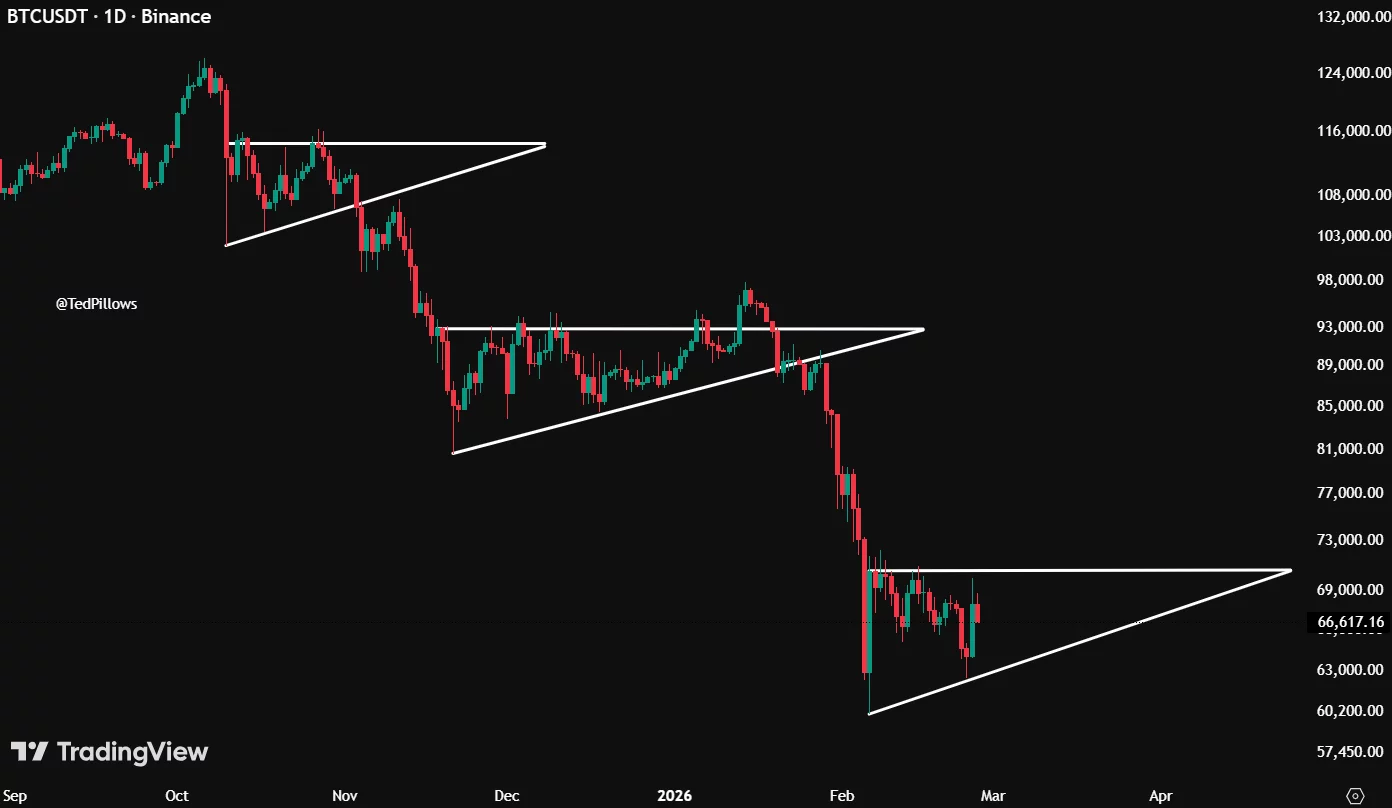 BTC/USDT 1-day chart | Source: X/TedPillows
“Once more people are convinced $60,000 was the bottom, the next dump to a new low will start,” said Pillows in a Feb. 26 X post.
Bitcoin has formed a bearish flag pattern on the daily chart. This pattern consists of a sharp price decline followed by a period of steady, upward consolidation within two parallel lines.
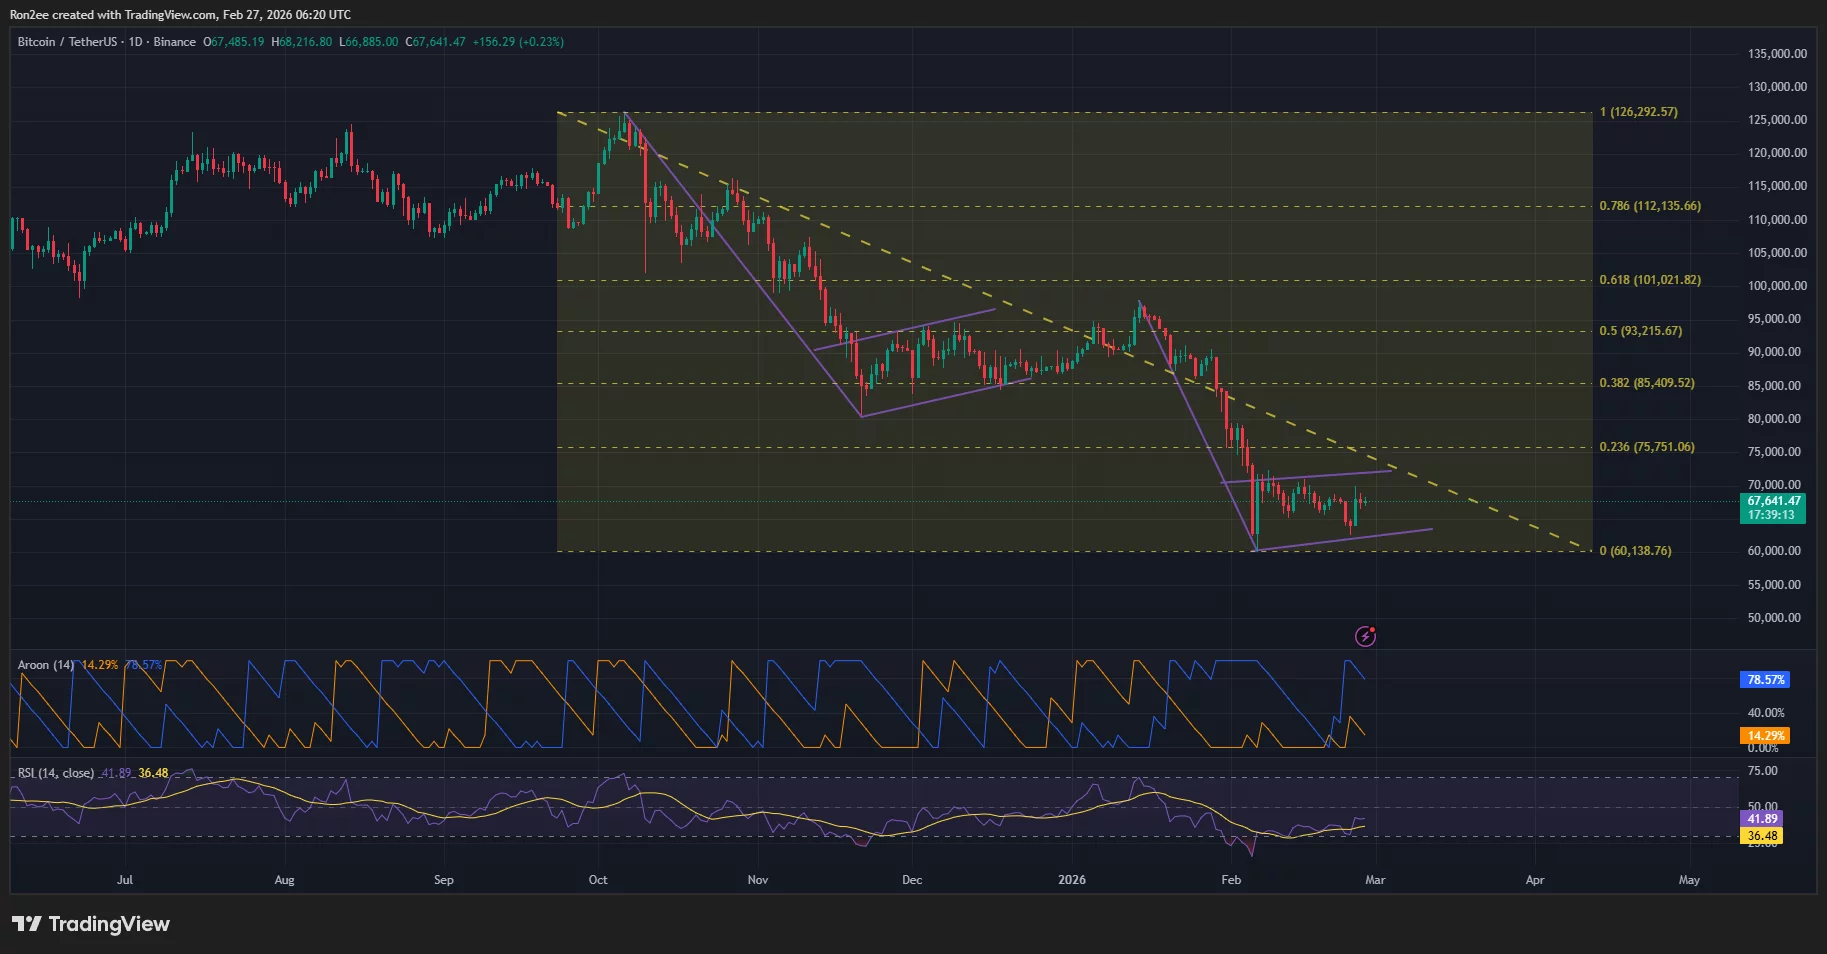 Bitcoin price has formed a bearish flag pattern on the daily chart — Feb. 27 | Source: crypto.news
Historically, Bearish flags have confirmed the continuation of an ongoing downtrend after short periods of consolidation.
At press time, other technical indicators also seem to show bears are currently at an advantage. Notably, the Aroon Down was at 78.55, which is significantly higher than the Aroon Up, suggesting bears were still dominating the market trend.
The Relative Strength Index, which has moved closer toward the neutral thresholds, also indicates that there is potential room for more downside pressure before the asset hits oversold levels.
For now, $65,000 remains the key support level to watch. The level has acted as a psychological defensive line for nearly three weeks and seems to be holding strong for now, as a large cluster of buy orders and long positions was seen accumulating in this range.
A sharp drop under the $65K mark could lead bears to target $60K, a psychological level bears tried to penetrate during the Feb. 6 crash.
Disclosure: This article does not represent investment advice. The content and materials featured on this page are for educational purposes only.


 English (US) ·