 1 hour ago
1
1 hour ago
1
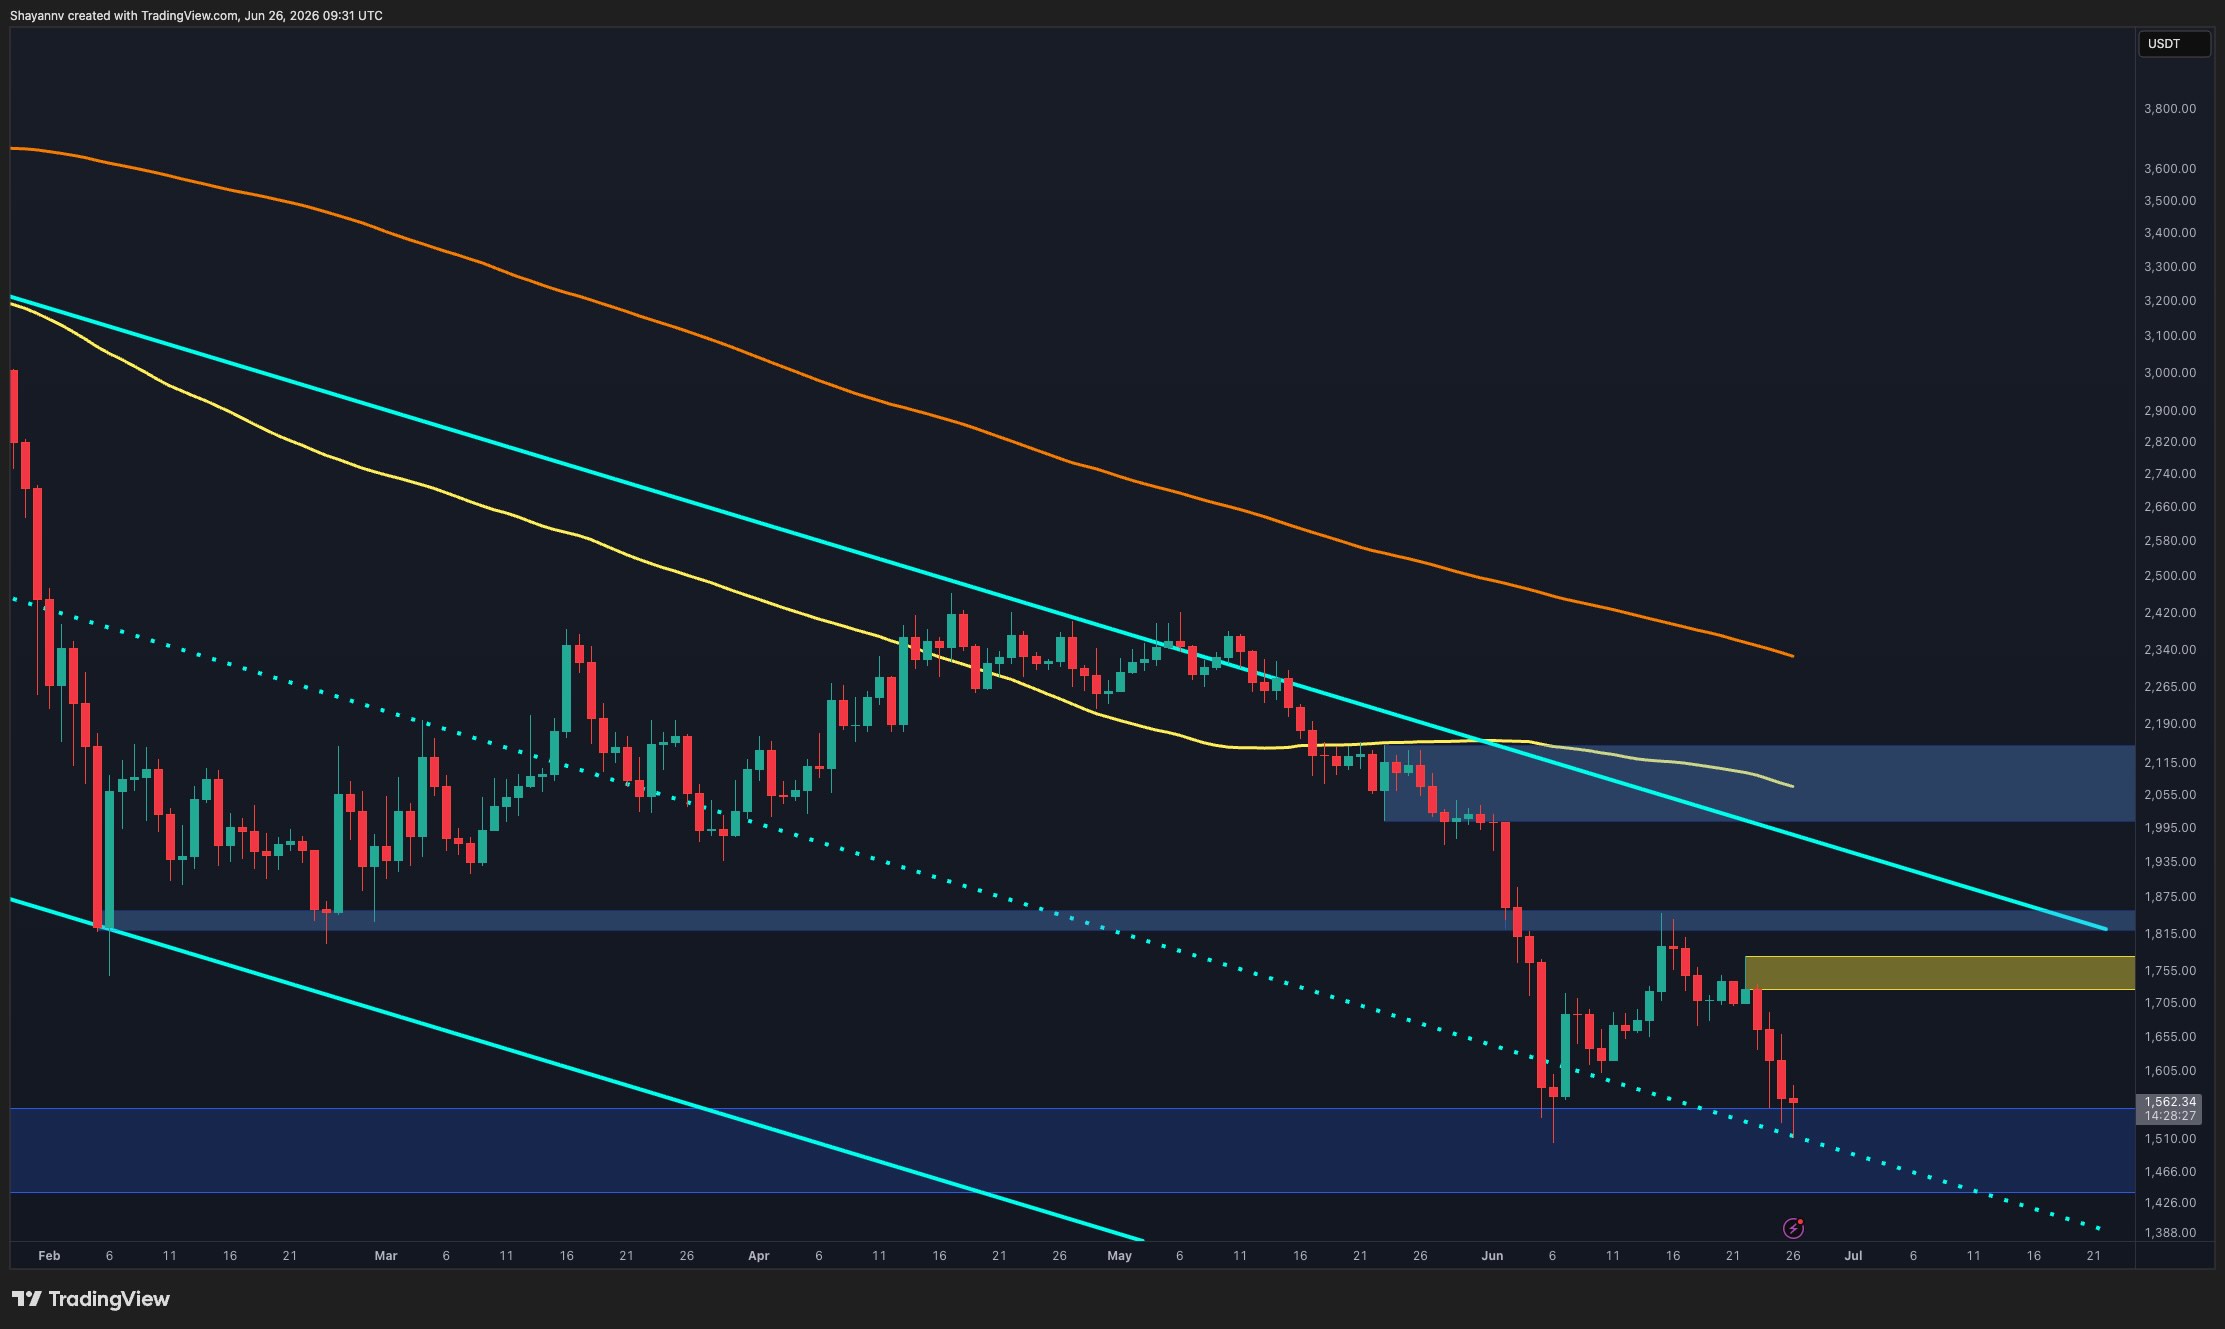
Ethereum remains under heavy selling pressure after another rejection at a key resistance level, with the latest decline pushing the asset back toward a major demand zone. While buyers are attempting to stabilize the price around support, the broader trend remains firmly bearish as ETH continues to trade below all major moving averages.
Ethereum Price Analysis: The Daily Chart
On the daily timeframe, Ethereum continues to print lower highs and lower lows while trading beneath the 100-day, 200-day, and long-term descending trendline, confirming that sellers remain in full control of the broader structure.
The recent recovery stalled precisely below the $1.72K to $1.78K supply zone before bearish momentum resumed. That rejection has now driven ETH back into the key support region around $1.46K to $1.56K, where buyers are once again attempting to defend the market.
This support zone has produced another reaction, but so far the rebound remains weak and has failed to alter the overall bearish structure. As long as Ethereum remains below the $1.72K to $1.78K resistance area, rallies are likely to be viewed as corrective rather than the beginning of a trend reversal.
A decisive loss of the current demand zone would expose the market to another leg lower, while reclaiming the nearby resistance would be the first indication that bearish momentum is beginning to fade.
ETH/USDT 4-Hour Chart
The 4-hour chart highlights the recent rejection at the $1.72K to $1.78K resistance zone, triggering another sharp decline toward the lower boundary of the established range.
Following that sell-off, ETH has bounced modestly from the $1.50K to $1.53K support area, suggesting buyers remain active around this demand zone. However, the asset continues to trade near the bottom of the broader consolidation range, while every recovery attempt has so far produced another lower high.
The current structure suggests Ethereum may continue consolidating between approximately $1.52K and $1.75K in the near term. The lower boundary remains the critical level to watch, as another breakdown below support could accelerate bearish momentum, whereas reclaiming the upper resistance would improve the short-term outlook and open the door for a stronger recovery.

Sentiment Analysis
The Exchange Netflow chart shows a notable increase in ETH moving onto exchanges over the most recent sessions, with the 14-day moving average of netflows turning sharply positive.
Historically, sustained positive exchange netflows indicate that more coins are being transferred to trading venues, often reflecting rising selling pressure or a greater willingness among holders to distribute their assets. This shift has coincided with Ethereum’s latest decline toward the $1.5K area.
Although exchange inflows alone do not guarantee additional downside, the recent surge suggests that supply entering exchanges remains elevated. Unless netflows begin to moderate while price stabilizes around the current demand zone, the on-chain data continues to favor a cautious outlook and supports the possibility of continued weakness before a more durable recovery can develop.

Binance Free $600 (CryptoPotato Exclusive): Use this link to register a new account and receive $600 exclusive welcome offer on Binance (full details).
LIMITED OFFER for CryptoPotato readers at Bybit: Use this link to register and open a $500 FREE position on any coin!
Disclaimer: Information found on CryptoPotato is those of writers quoted. It does not represent the opinions of CryptoPotato on whether to buy, sell, or hold any investments. You are advised to conduct your own research before making any investment decisions. Use provided information at your own risk. See Disclaimer for more information.


 English (US) ·