XRP’s price has retreated for six consecutive weeks, in line with the broader market’s performance.
Summary
- XRP price has retreated and moved into a bear market in the past few months.
- Ripple USD’s stablecoin supply has jumped to over $1.5 billion for the first time ever.
- The coin has become oversold and formed a falling wedge chart pattern.
Ripple (XRP) token was trading at $1.3915 on Thursday, down by 62% from its all-time high of $3.6590. Technical indicators suggest the coin may be about to rebound as demand for the Ripple USD (RLUSD) stablecoin rises.
Ripple USD supply is rising
There are signs that demand for the RLUSD stablecoin is growing, a trend that may accelerate after Binance completes its integration on the XRP Ledger. The integration enabled users to deposit and withdraw the token on the largest crypto exchange in the industry.
Data compiled by Artemis shows that the supply of RLUSD in circulation jumped to over $1.5 billion for the first time ever. $1.1 billion of these tokens are in Ethereum, while the rest is in the XRP Ledger.
In a statement on Thursday, Jack McDonald, the Senior Vice President at Ripple Labs, hinted that the stablecoin will overtake “traditional dollar, Venmo, PayPal, and others.” He pointed to the rising institutional demand for the coin, especially as the developers gears to launch the Permissioned DEX platform.
🚨BREAKING: Ripple SVP Signals RLUSD Is Built to OVERTAKE Traditional Dollar, PayPal, Venmo — “Stablecoins Are the Ideal Use Case” 🤯🔥
Institutions are NOT moving serious capital overnight or on weekends through consumer apps like PayPal or Venmo.
They need to move LARGE… pic.twitter.com/kfTaoaKJcE
Artemis data show that RLUSD’s usage continues to grow. It handled over 480,000 transactions in the last 30 days, while the adjusted transaction volume soared to close to $4.9 billion. Most of the volume was in decentralized finance, followed by blockchains and centralized exchanges.
Meanwhile, XRP price may benefit from the ongoing ETF inflows. Data compiled by SoSoValue show that spot XRP ETFs have added over $48 million this month so far, more than Bitcoin and Ethereum, which have shed substantial assets in the past few months.
XRP price prediction: Technical analysis
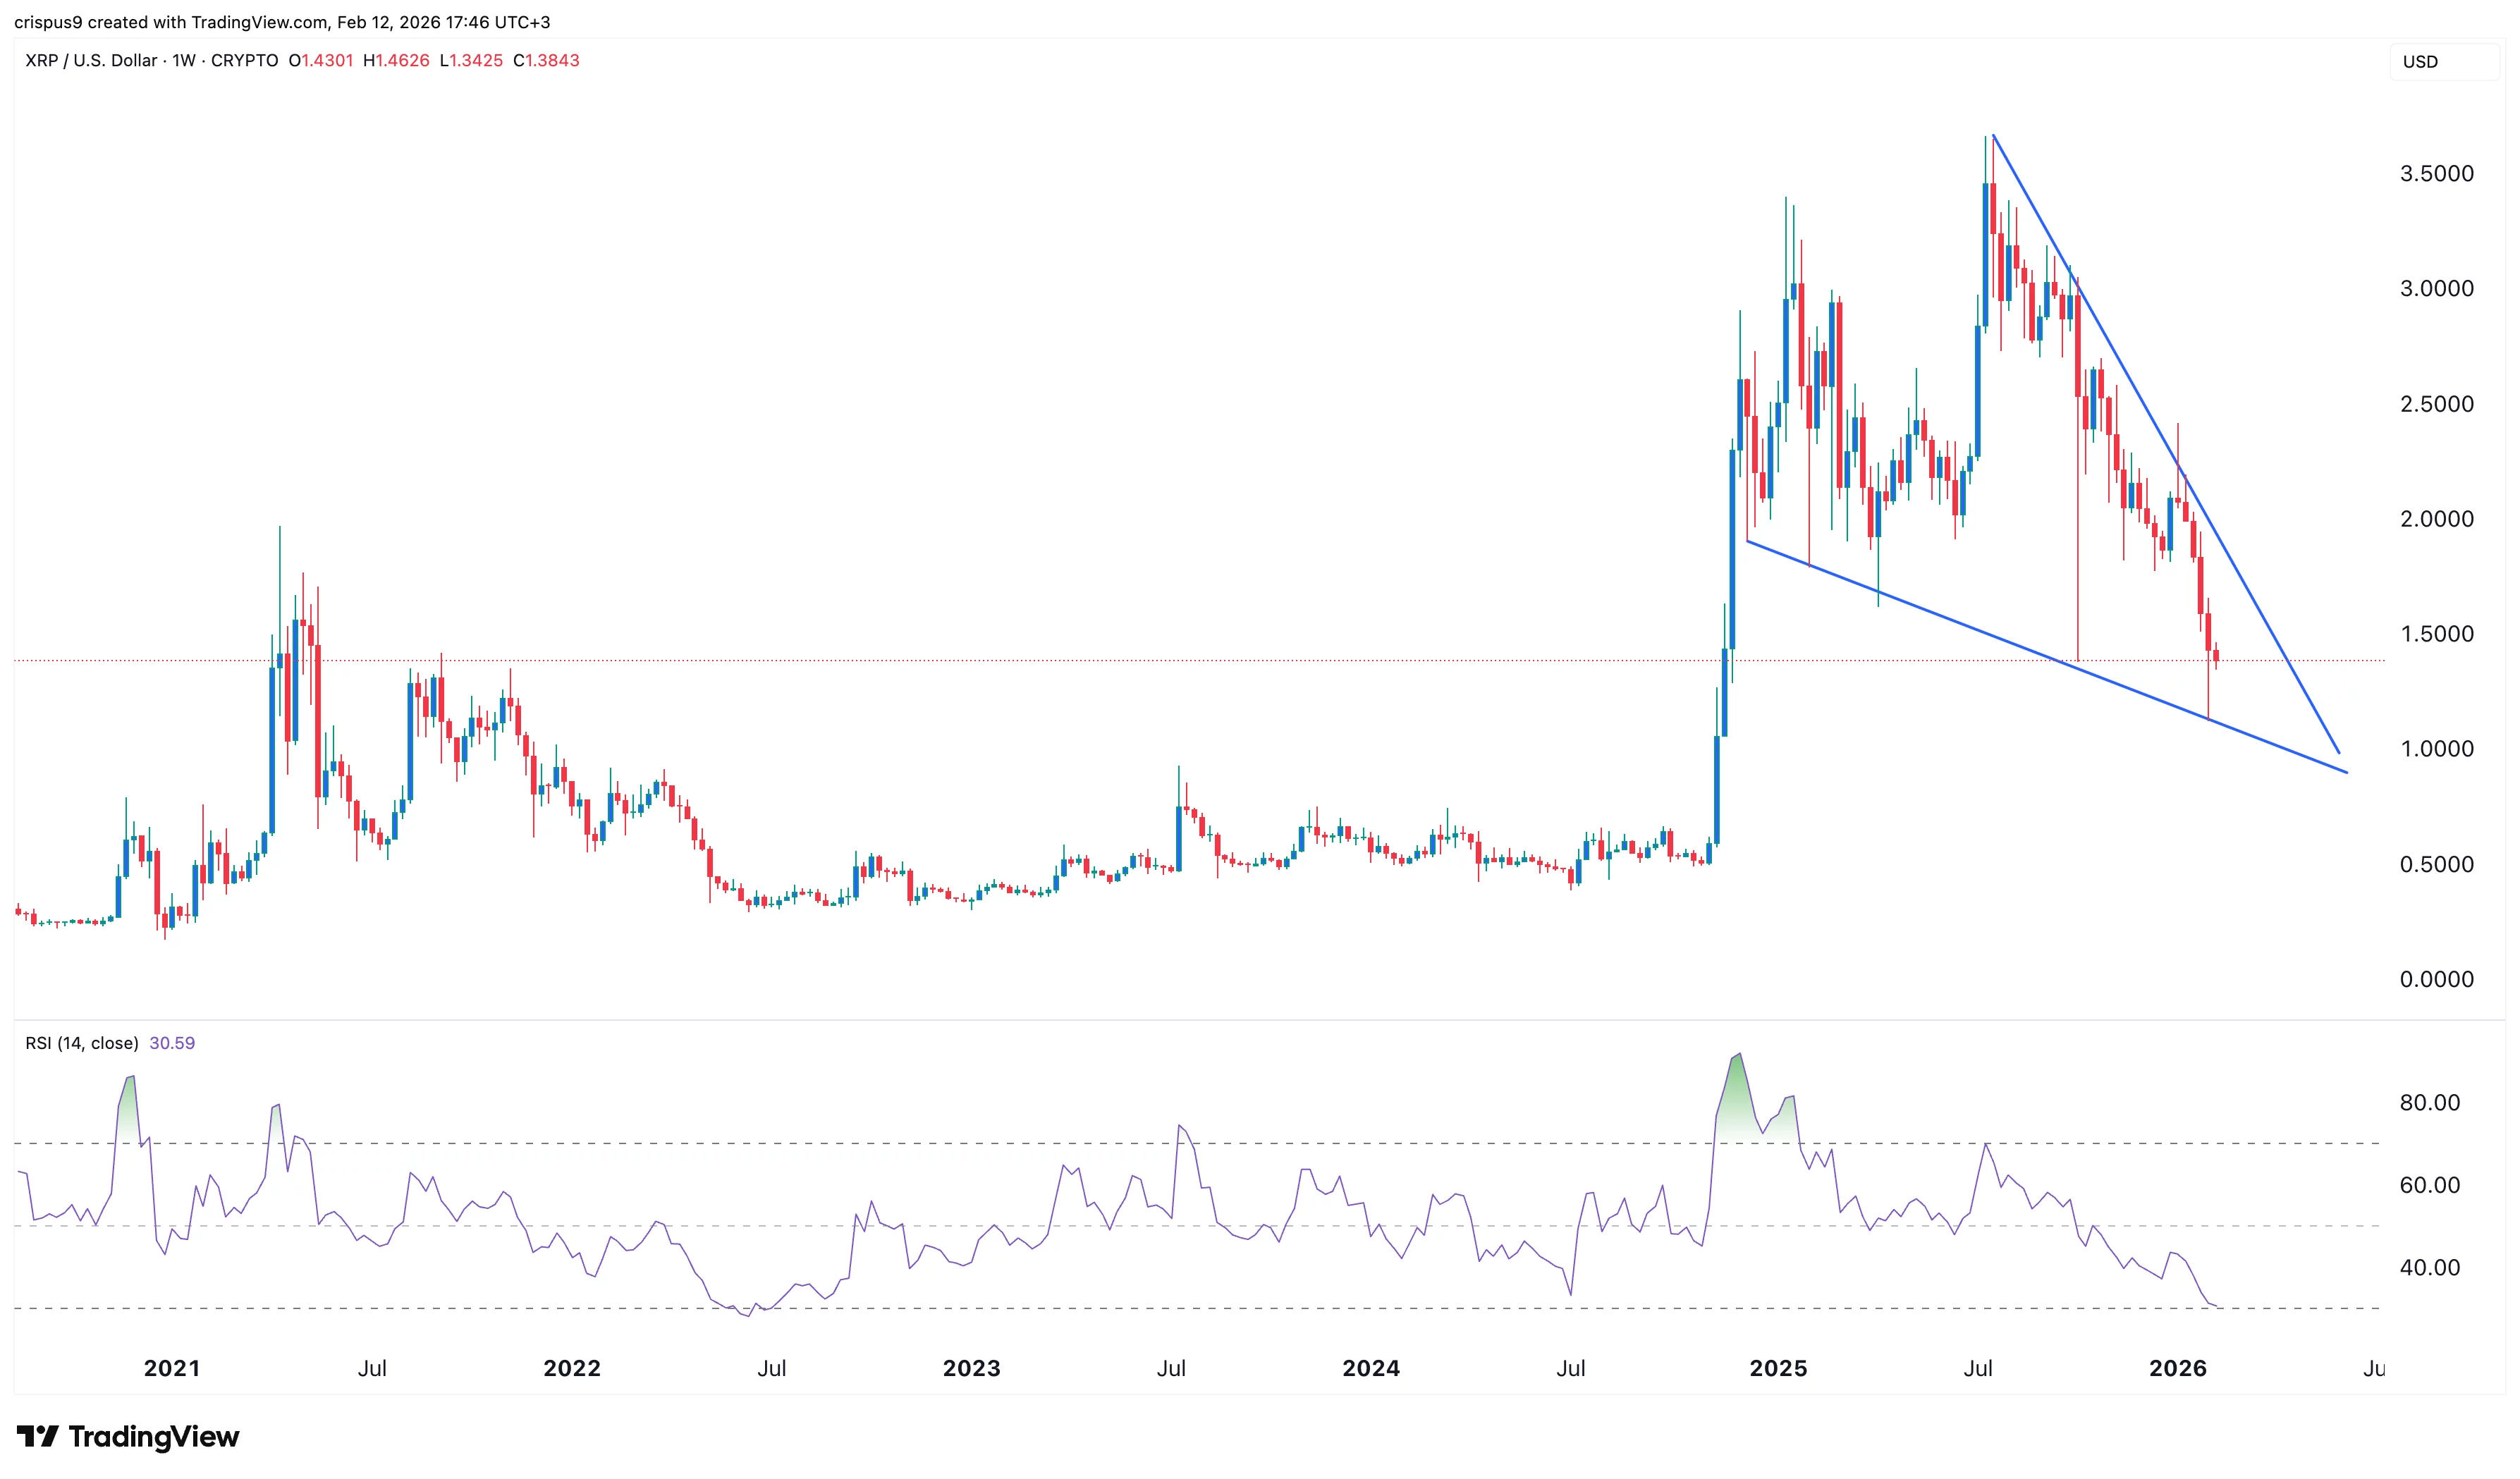 Ripple price chart |Source: crypto.news
 The weekly timeframe chart shows that the XRP price has pulled back in the past few months as the crypto market crash accelerated.
The Relative Strength Index has moved to the oversold level of 30, its lowest level since August 2022. It is common for a coin to rebound after moving to the oversold level.
XRP has also formed a large falling wedge pattern, consisting of two descending, converging trendlines that are nearing the confluence point.
Therefore, the coin will likely rebound in the coming weeks, potentially reaching the key psychological level of $2.0, which is 45% above the current level.


 English (US) ·