XRP (XRP) is currently displaying a technical pattern that follows a 2025 fractal that produced 66% gains. The daily chart shows XRP price breaking out of a bull flag, which can also result in massive gains.
Key takeaways:
- XRP is currently displaying a technical pattern similar to the 2025 price action that ignited a 66% price rally
- XRP’s spot taker CVD has turned positive, suggesting confidence among buyers.
XRP price chart fractal targets $2.35
XRP’s price action in the daily time frame mirrors a technical structure after recovery from the April 2025 cycle low, preceding a sharp upward continuation.
The formation came after a multi-week consolidation inside a bull flag, followed by a bullish cross by the 20-day and 50-day exponential moving averages (EMAs), as shown in the chart below.
Related: XRP set for ‘strongest’ 2026 monthly ETF inflows as bulls target $2
The XRP/USD broke above the upper boundary of the flag in early July 2025, triggering a cascade of short liquidations and fresh buying that ultimately delivered 66% gains to its current all-time high of $3.66, less than two weeks later.
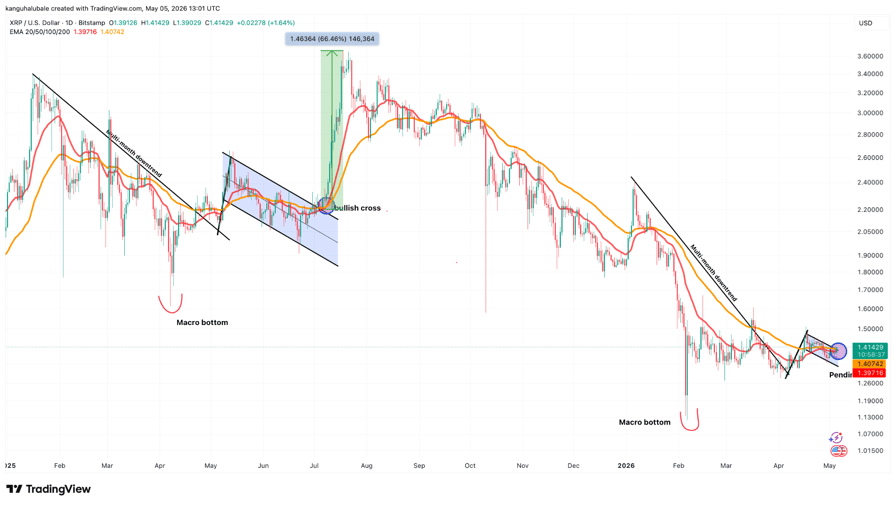
XRP/USD daily chart. Source: Cointelegraph/TradingView
XRP’s current price action is following a similar pattern, with the price again breaking out of a bull flag pattern and a pending bullish crossover from the moving averages.
If history repeats itself, XRP/USD may rally by more than 66% toward $2.35. Further confirmation of a trend reversal now hinges on the price holding above $1.40, which is also the flag's upper boundary and the 50-day SMA.
“XRP is gaining momentum above $1.40, holding firmly over its 100-hour SMA” analyst Jack Straw said in a Tuesday post on X, adding:
“A clean break above $1.420 could trigger the next leg up.”Fellow analyst Sam Mti said XRP was "looking good" after a buy signal from the MTI indicator, with potential to move above $1.45 as long as support at $1.40 holds.
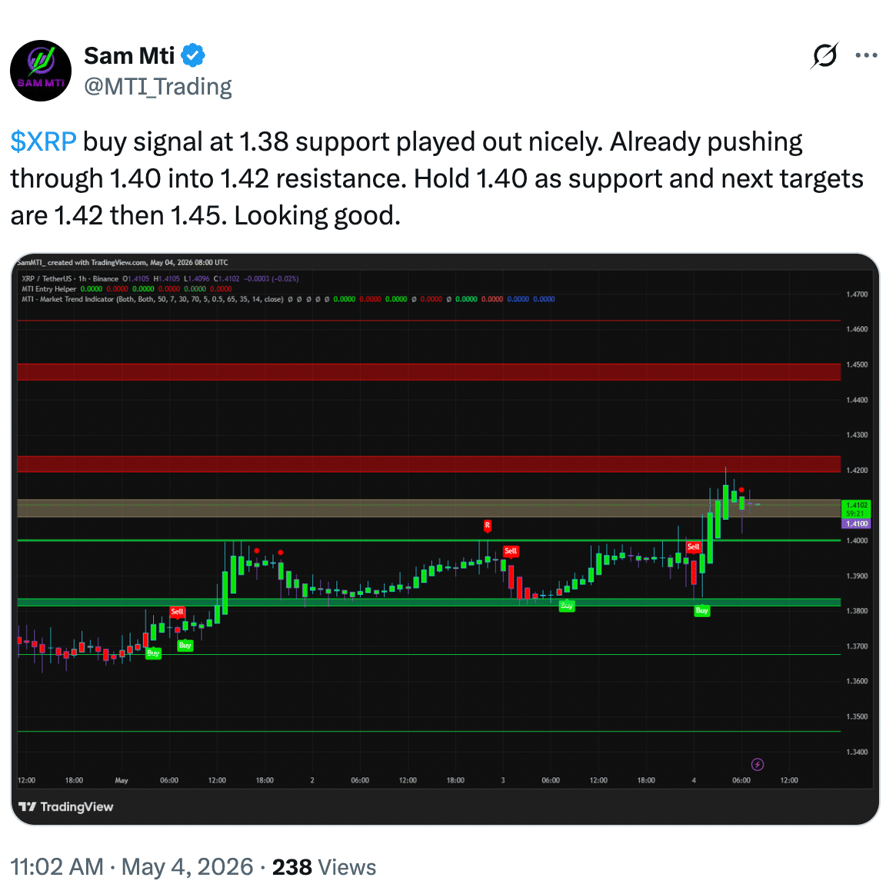
XRP/USD 1-hour chart. Source: Sam Mti
As Cointelegraph reported, buyers will gain the upper hand on a close above the $1.40 level, paving the way for an XRP rally toward $2, then to $2.40.
XRP’s spot taker CVD suggests buyers are back
XRP’s 90-day spot taker cumulative volume delta (CVD) shows that buy-orders (taker buy) have become dominant again. CVD measures the difference between buy and sell volume over three months.
The metric flipped positive (green bars in the chart below) on May 1 as the price broke above the $1.38 resistance and has remained positive since. This indicates optimism among traders, as they’re actively positioning for further gains.
If the CVD remains green, it means buyers are not backing down, which could set the stage for another rally as seen in the past. A similar occurrence in June 2025 accompanied 70% XRP price gains.
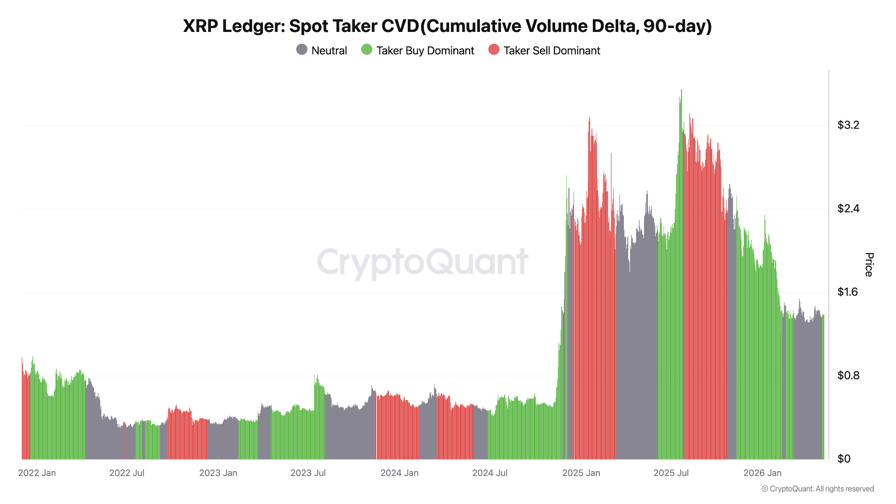
XRP spot taker CVD. Source: CryptoQuant
Meanwhile, XRP’s open interest (OI) delta flipped positive, rising to as high as $27 million on May 1, reflecting a change in active derivatives positioning, data from CryptoQuant shows
“A sharp positive reading suggests that new positions are being added to the market,” CryptoQuant analyst Amr Taha said in a QuickTake analysis on Tuesday, adding:
“When this happens while price is rising, it often shows that traders are increasing exposure as momentum begins to recover.”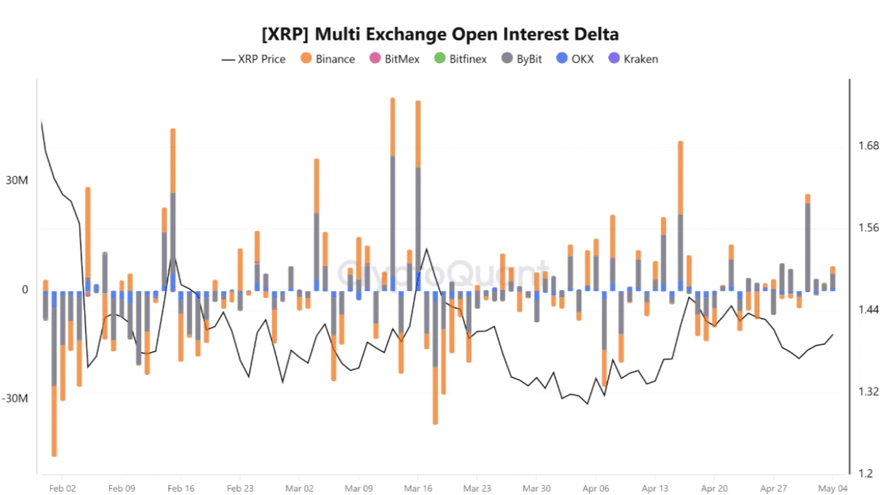
XRP OI delta across exchanges. Source: CryptoQuant
This article is produced in accordance with Cointelegraph's Editorial Policy and is intended for informational purposes only. It does not constitute investment advice or recommendations. All investments and trades carry risk; readers are encouraged to conduct independent research.


 English (US) ·