 1 month ago
22
1 month ago
22
Ethereum is opening Q2 2026 trading above $2.1k, still well below the levels needed to suggest any meaningful trend reversal. After a brutal first quarter that saw ETH lose around a third of its value from the late-2025 highs, the question heading into the new quarter is whether the asset can finally find a base, or whether the selling pressure has more room to run.
Ethereum Price Analysis: The Daily Chart
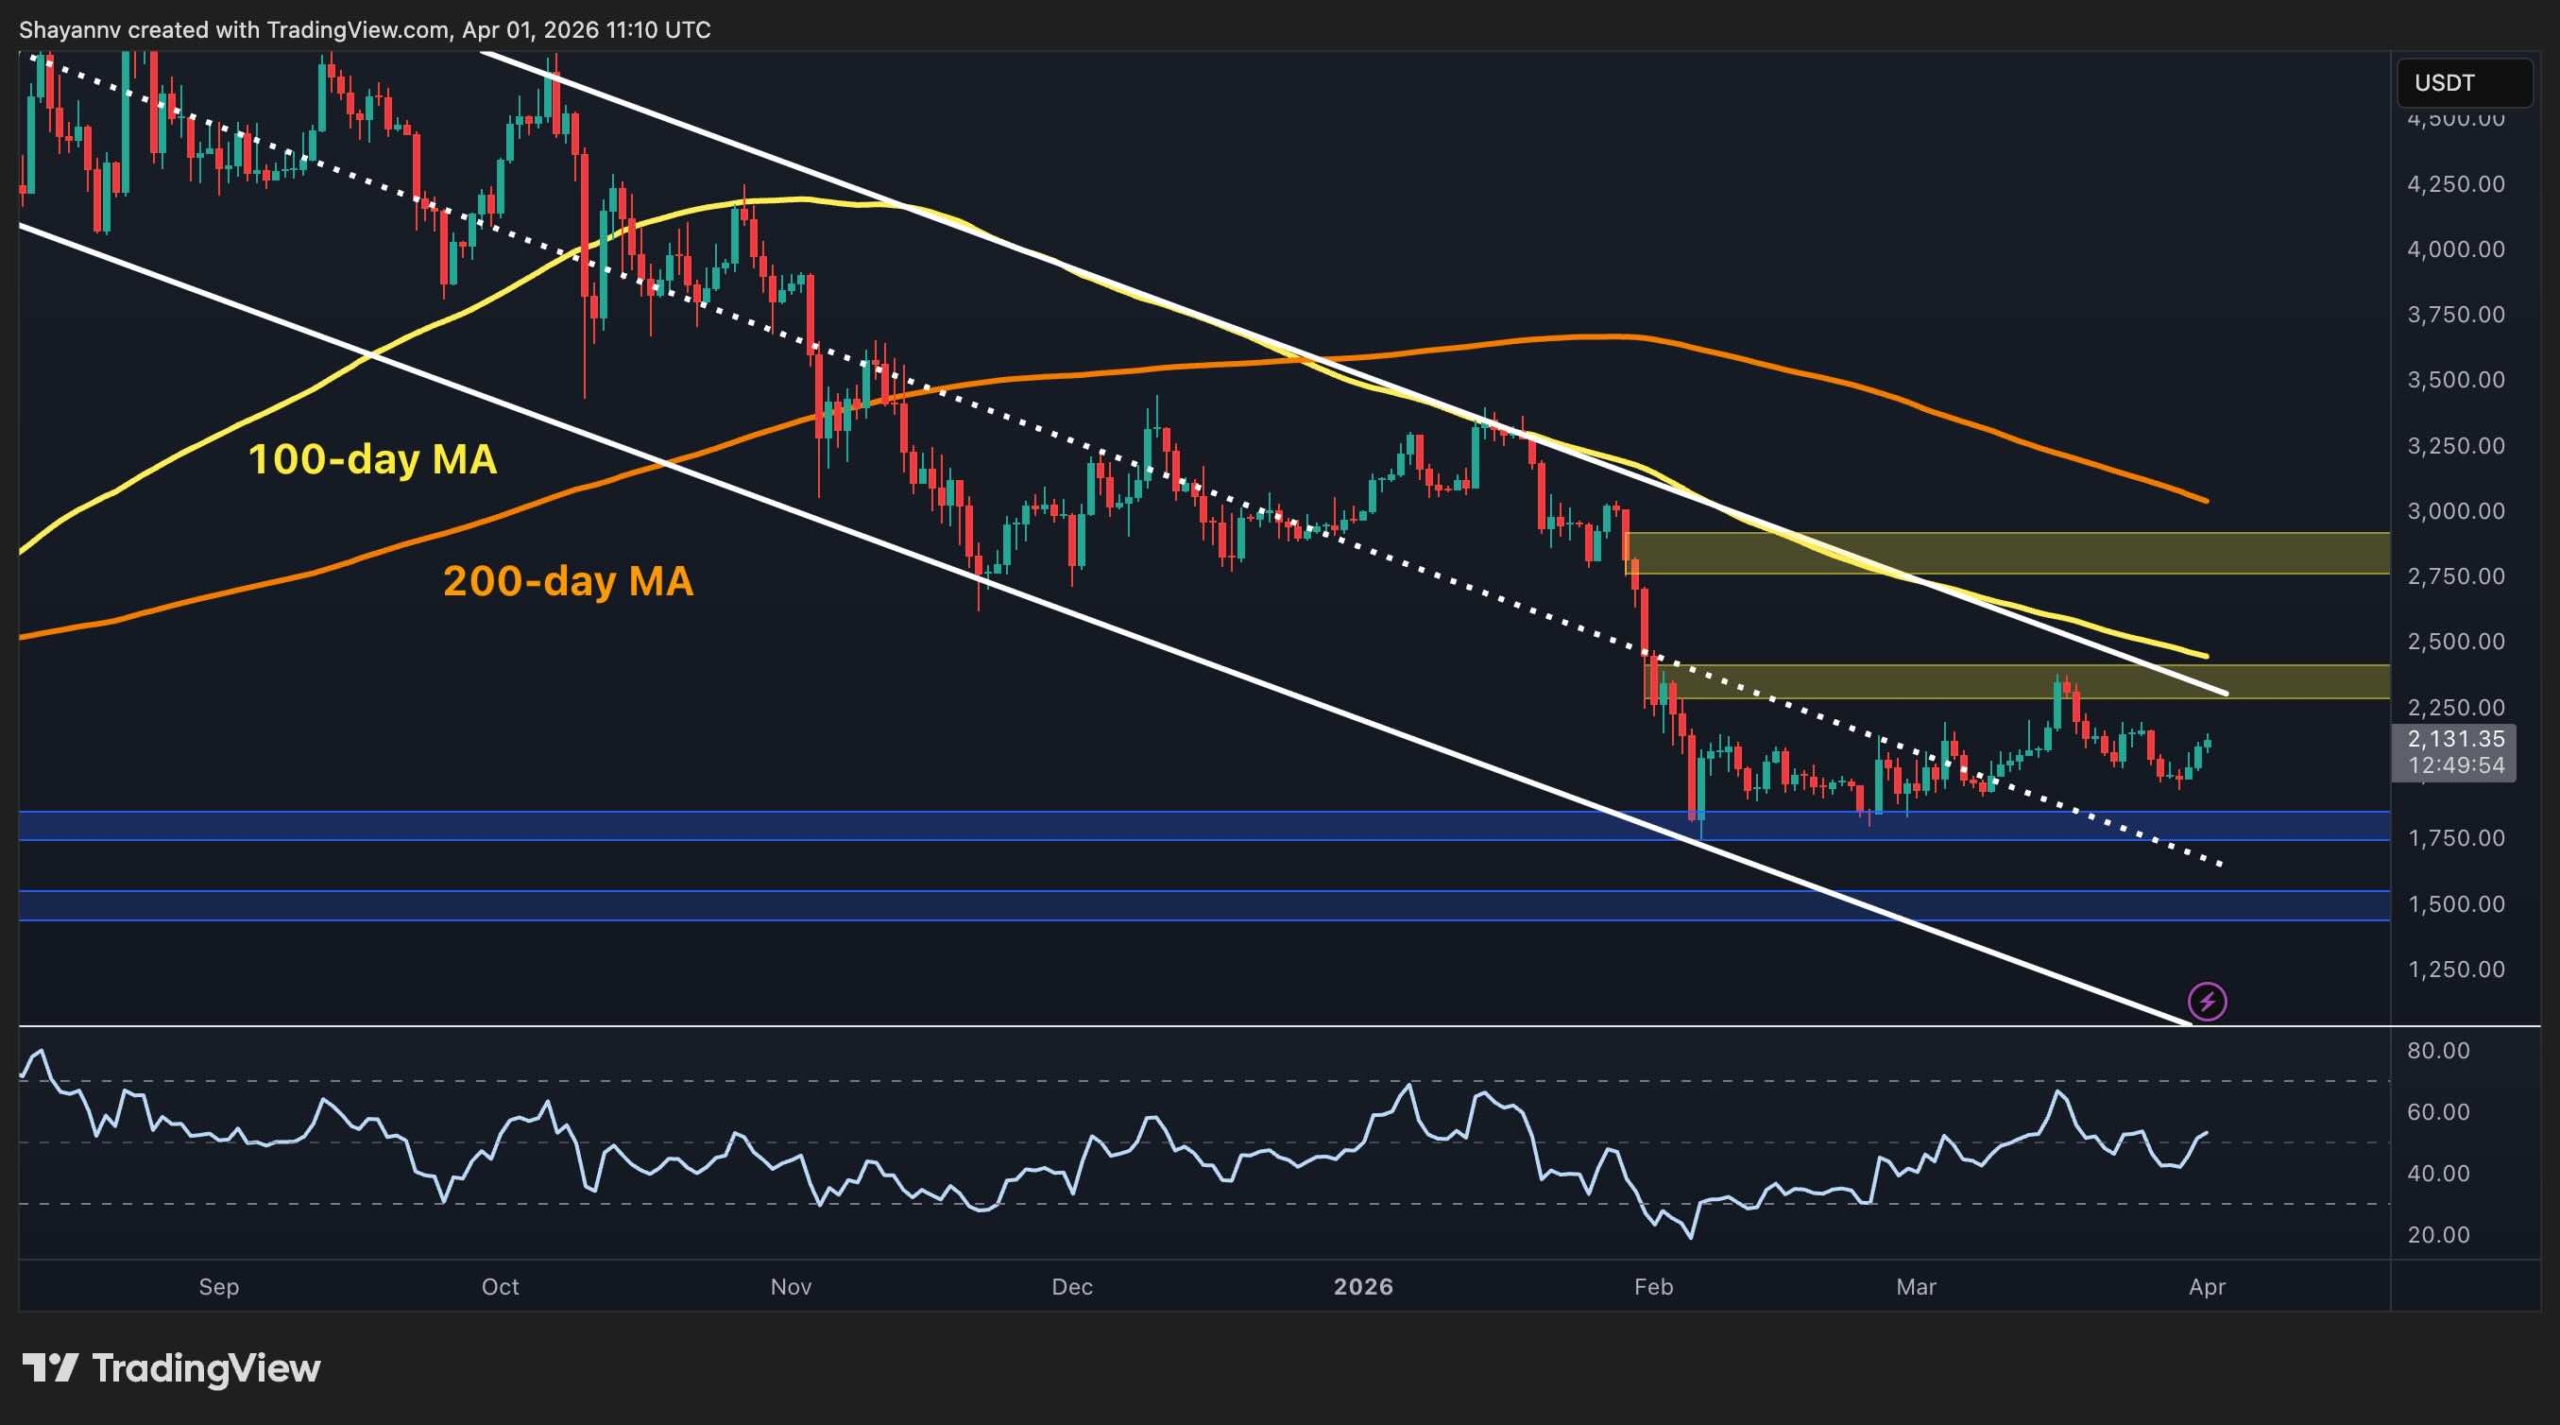
The descending channel on the daily chart remains fully intact heading into April. ETH continues to print lower highs beneath a declining 100-day MA (~$2.4k) and 200-day MA (~$3k). The $2.4k resistance band has now rejected the asset decisively after the February low. This reinforces the area as the key supply zone to clear before any bullish case can be made.
The support level at $1.8k remains the critical floor. It held during the February capitulation and has been tested again since without breaking down on a closing basis. Below that, $1.5k is the next meaningful level.
Moreover, the RSI is hovering around the mid-50s, which reflects some stabilization, but that alone is not enough to shift the broader trend. Therefore, a sustained daily close above $2.4k is still the minimum threshold buyers need to target to change the price action regime.
ETH/USDT 4-Hour Chart
On the shorter timeframe, ETH has been trading inside a falling wedge pattern since the mid-March rejection at $2.4k. The price is currently north of $2.1k after breaking above the upper boundary of the pattern over the past few days. With the RSI now pushing into the low-70s, which is the highest reading since the March peak, the market is likely to climb higher in the short term.
That RSI level is worth watching closely. The momentum suggests a potential retest of the $2.3k–$2.4k resistance zone is likely – a significant daily level that sits directly above and has already rejected ETH once recently. A clean break above this level would be a constructive mid-term signal. However, failure to keep the bullish momentum can cause the market to drop toward the $1.8k key support zone once more.

On-Chain Analysis
Ethereum’s exchange reserve has fallen to approximately 14.9M ETH. This is the lowest level recorded over the past year, and the metric is continuing a decline that accelerated sharply through late 2025 and into 2026. The drawdown from the mid-2025 peak near 21M ETH has been steep and consistent. It reflects a sustained trend of holders withdrawing ETH from exchanges into self-custody.
As with Bitcoin, declining exchange reserves reduce the immediately available sell-side supply, which is structurally constructive over the medium term. However, the same caveat applies: reserves have been falling in parallel with price, not ahead of a recovery.
The supply-side picture is improving, but without a meaningful pickup in demand, which should be visible through price reclaiming key levels and the aggregate on-chain activity trending higher, the reserve data is better read as a foundation being quietly built rather than a catalyst in itself.

Binance Free $600 (CryptoPotato Exclusive): Use this link to register a new account and receive $600 exclusive welcome offer on Binance (full details).
LIMITED OFFER for CryptoPotato readers at Bybit: Use this link to register and open a $500 FREE position on any coin!
Disclaimer: Information found on CryptoPotato is those of writers quoted. It does not represent the opinions of CryptoPotato on whether to buy, sell, or hold any investments. You are advised to conduct your own research before making any investment decisions. Use provided information at your own risk. See Disclaimer for more information.


 English (US) ·