 1 month ago
31
1 month ago
31
Ethereum price started a fresh increase and tested $2,200. ETH is now correcting gains and might decline further if it trades below $2,030.
- Ethereum started a downside correction below the $2,120 zone.
- The price is trading above $2,065 and the 100-hourly Simple Moving Average.
- There is a key bullish trend line forming with support at $2,030 on the hourly chart of ETH/USD (data feed via Kraken).
- The pair could start a fresh decline if it stays below the $2,135 zone.
Ethereum Price Starts Downside Correction
Ethereum price started a fresh increase above the $2,065 resistance, like Bitcoin. ETH price rallied above the $2,120 and $2,150 resistance levels.
The bulls even pumped the price above $2,180. A high was formed at $2,200 before there was a downside correction. The price dipped below $2,120 and tested the 50% Fib retracement level of the upward move from the $1,929 swing low to the $2,200 high.
Ethereum price is now trading above $2,065 and the 100-hourly Simple Moving Average. There is also a key bullish trend line forming with support at $2,030 on the hourly chart of ETH/USD.
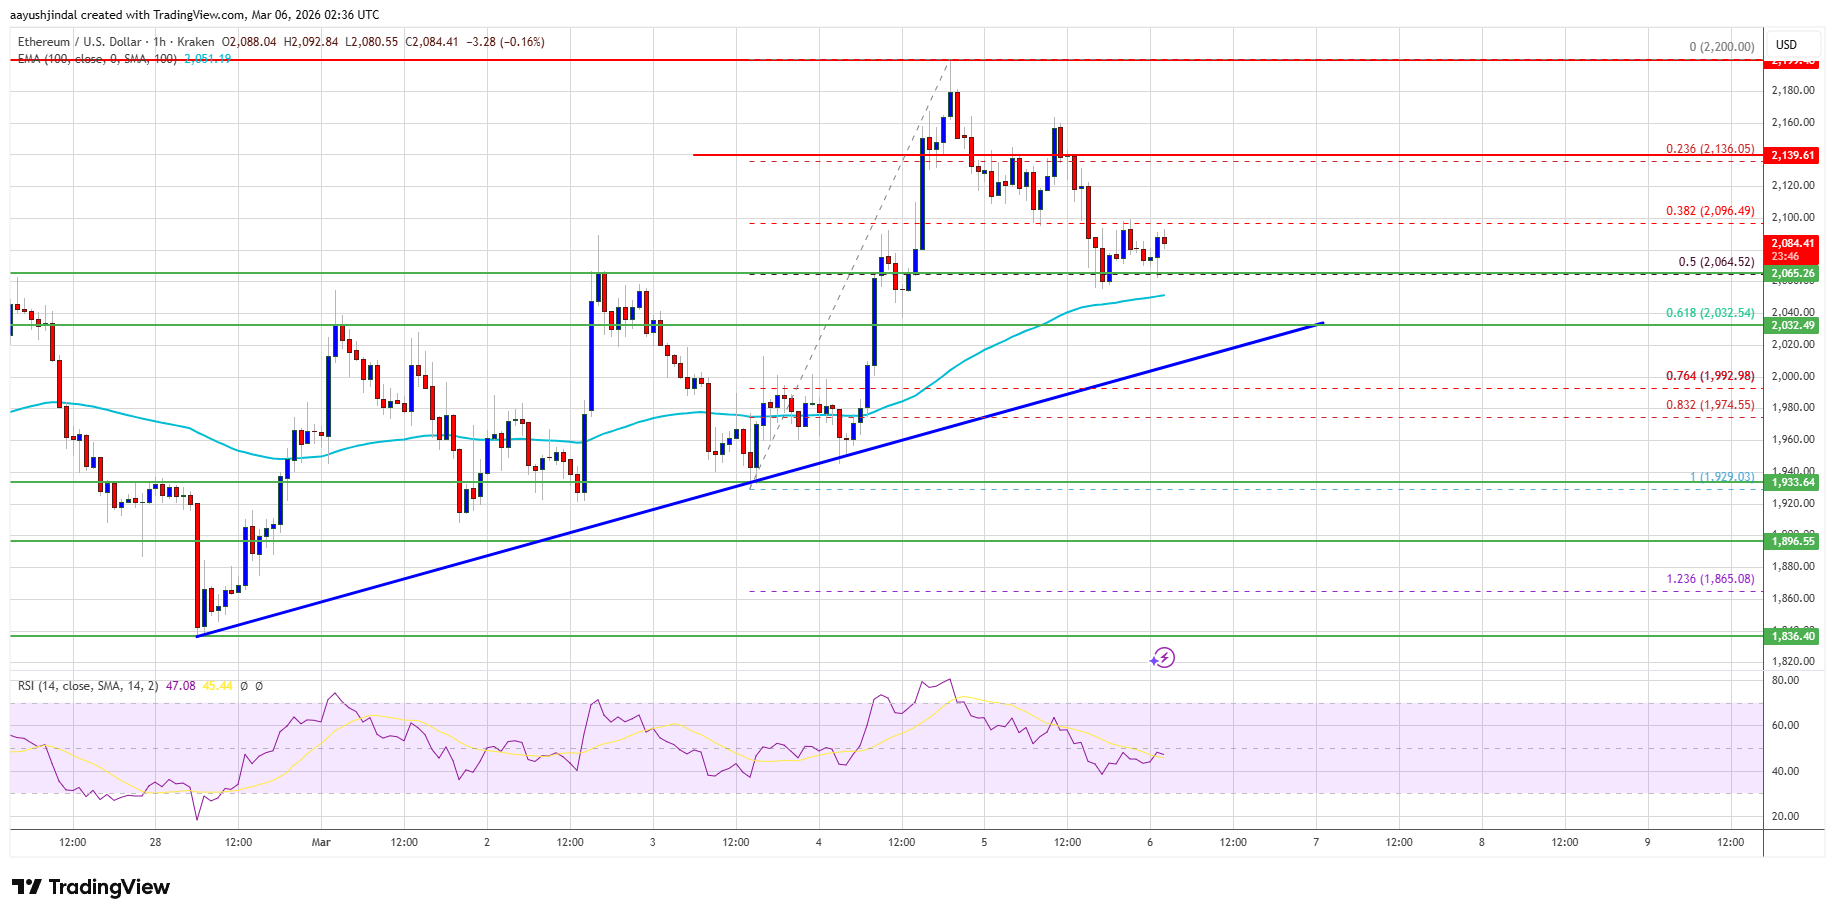 Source: ETHUSD on TradingView.com
If the bulls remain in action above $2,030, the price could attempt another increase. Immediate resistance is seen near the $2,100 level. The first key resistance is near the $2,135 level. The next major resistance is near the $2,150 level. A clear move above the $2,150 resistance might send the price toward the $2,200 resistance. An upside break above the $2,200 region might call for more gains in the coming days. In the stated case, Ether could rise toward the $2,250 resistance zone or even $2,320 in the near term.
More Losses In ETH?
If Ethereum fails to clear the $2,135 resistance, it could start a fresh decline. Initial support on the downside is near the $2,065 level. The first major support sits near the $2,030 zone, the trend line, and the 61.8% Fib retracement level of the upward move from the $1,929 swing low to the $2,200 high.
A clear move below the $2,030 support might push the price toward the $2,000 support. Any more losses might send the price toward the $1,965 region. The main support could be $1,920.
Technical Indicators
Hourly MACD – The MACD for ETH/USD is losing momentum in the bullish zone.
Hourly RSI – The RSI for ETH/USD is now below the 50 zone.
Major Support Level – $2,030
Major Resistance Level – $2,135


 English (US) ·