Bitcoin is trading above $82,000 on May 6, while oil, Treasury yields, the dollar, and US stocks shift around the same volatile geopolitical and macro backdrop that has left investors exhausted after the last few months.
The move reopens the inflation-hedge debate while leaving it unresolved. It also puts pressure on the claim that BTC has made a lasting break from equities.
For now, the low-$80,000 area is the market's cleanest test of whether BTC is catching a new bid from macro volatility or whether buyers are chasing another bear-market rebound.
The current setup is unusually compressed. As of press time, CryptoSlate's Bitcoin page shows the price near $82,000, with Bitcoin dominance around 60.4% and 24-hour volume above $40 billion.
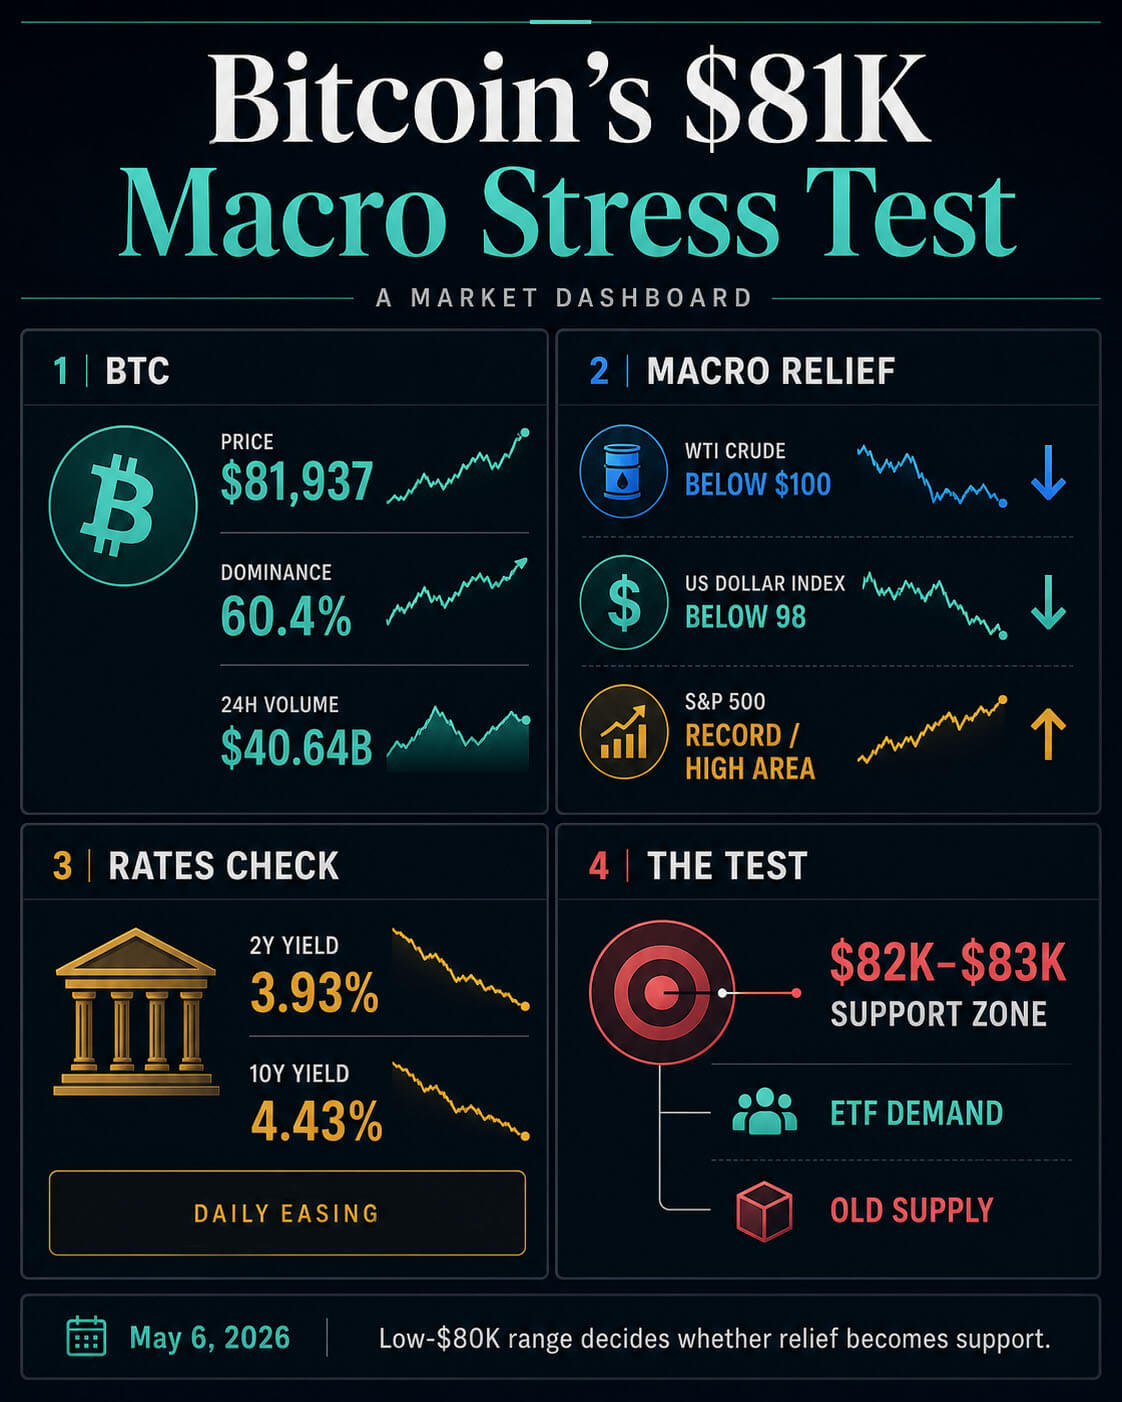
At the same time, WTI crude has fallen below $100, the US Dollar Index is below 98, official Treasury data shows 2-year and 10-year yields easing from the prior daily reading, and the S&P 500 is near a record-high area.
The result is a market picture that can be read two ways. Bitcoin may be drawing conditional demand from investors looking for a liquid hedge against policy and geopolitical disorder.
It may also be moving through different parts of the risk cycle as ETF demand, Asia-led technology risk appetite, oil headlines, and dollar weakness hit at different times.
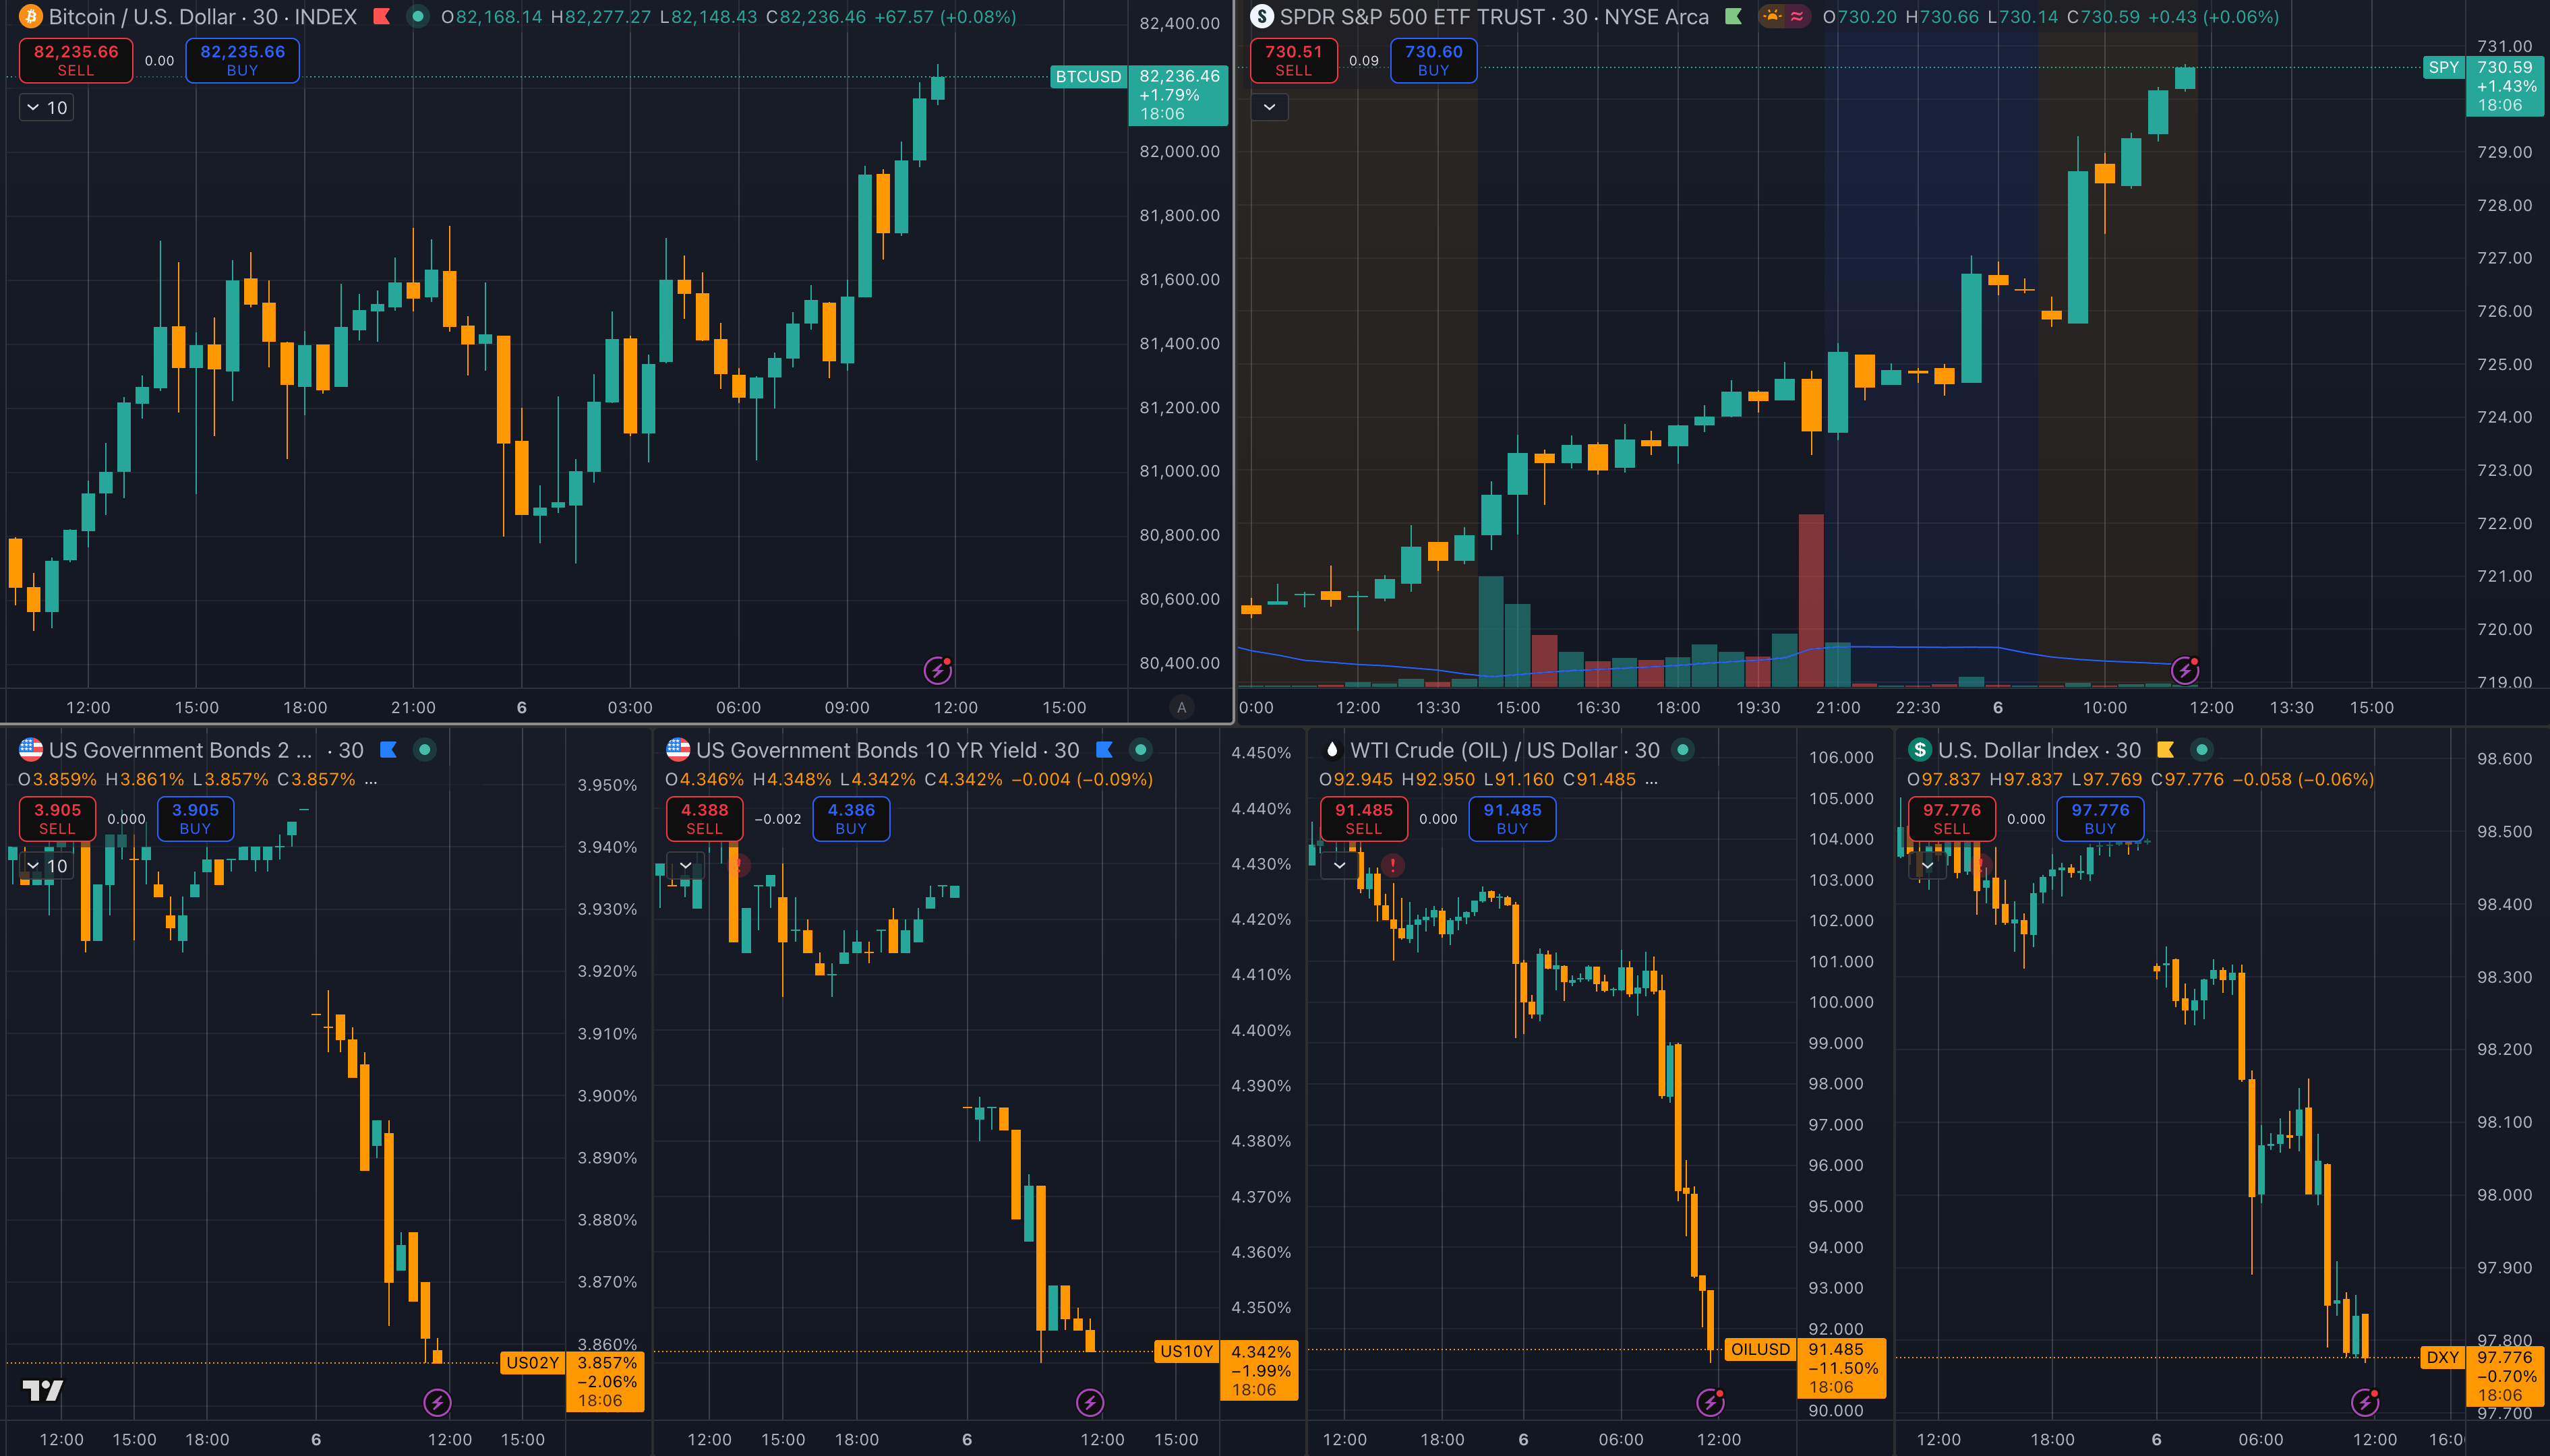 Bitcoin price vs macro instruments May 6
The macro relief trade has several signals
The macro backdrop has improved quickly again, but each piece carries a different message. Crude below $100 eased the immediate inflation shock from earlier oil pressure. A weaker dollar made dollar-priced risk assets easier to hold.
The S&P 500's record/high-area move showed that traditional risk appetite remained active. Treasury's daily curve, meanwhile, showed only a small close-to-close easing in the 2-year and 10-year yields, even though intraday chart action looked sharper.
That distinction is important because the Bitcoin argument weakens if the bond-market move is overstated, which is happening across social media.
The daily Treasury data points to a more restrained version: yields backed off, oil and the dollar relieved pressure, and stocks stayed strong enough to complicate the idea that BTC was simply escaping equities.
A prior CryptoSlate analysis framed this as a possible break from SPY, but also warned that the split may reflect different lead markets and trading sessions.
That is the more useful take right now. Bitcoin is moving across several macro dials at once, sitting at the intersection of oil risk, rates, the dollar, ETF demand, and old supply being sold into rallies.
| BTC above $81,000 | Buyers are defending the low-$80,000 area | $82,000-$83,000 still needs to become support |
| WTI below $100 and DXY below 98 | Macro pressure on risk assets has eased | The move is headline-sensitive and can reverse quickly |
| S&P 500 near a record/high area | Risk appetite remains active outside crypto | This complicates a clean equity-decoupling claim |
| ETF inflows and profit-taking | New demand is meeting old supply | The rally needs continued absorption above $80,000 |
| Weak-demand frameworks | Bear-market risks have not cleared | On-chain signals must improve to confirm trend strength |
The table shows why the move is better understood as a stress test rather than a declaration. BTC is strong enough to force a fresh read, but every bullish signal has a caveat attached.
The macro relief backdrop helps, yet stocks are also strong. ETF inflows help, yet long-term holders are using higher prices to distribute. The on-chain backdrop is improving in places, yet recent frameworks still say demand and trend confirmation need more proof.
ETF demand is doing the heavy lifting
The bullish case starts with absorption. Long-term holders were distributing into strength while spot Bitcoin ETFs took in more than $1.1 billion across the first two trading days of May, according to CryptoSlate.
That signal carries more weight than the headline price print. Bitcoin can rise through resistance when fresh demand keeps taking the other side of older supply.
ETF demand also changes the market structure of a rebound. Spot funds give brokerage-account buyers a regulated way to add exposure while bypassing exchange custody and wallet management.
That demand can arrive even when on-chain metrics look soft. In the current setup, a weak-demand framework and a rising price can coexist for longer than they would in a market driven mostly by native crypto exchange flow.
Traders are also watching more than $81,000. The market has spent weeks treating the low-$80,000 area as both a recovery line and a seller test.
A push above it shows demand, but a hold above $82,000-$83,000 would say something stronger: buyers are turning prior resistance into a base instead of only reacting to a macro relief window.
The ETF channel also keeps the institutional story more precise. It is tempting to describe the move as broad institutional demand returning, but the strongest evidence points to ETF demand.
ETF inflows can be powerful and still be tactical. They can also dry up if the macro impulse flips, if volatility picks up, or if price stalls where long-term holders are willing to sell.
This makes flow persistence the deciding input. A single strong inflow window can lift price through a crowded level, but a durable breakout needs repeated absorption after the first relief bid fades.
If ETF demand keeps meeting seller supply above $80,000, the low-$80,000 range becomes a base. If flows cool while long-term holders keep distributing, the same level becomes a ceiling again.
Why the bull-trap question is still live
The strongest argument against chasing the move is that price has improved faster than some of the underlying demand signals.
CryptoSlate's earlier bear-market framework pointed to weak demand, subdued liquidity, moving-average pressure, and the need for trend reclamation before calling a durable turn.
Glassnode's late-April on-chain work also kept focus on cost-basis stress and holder behavior around the $79,000-$80,000 zone.
The rebound can still be real while the burden of proof stays with buyers. A bear-market rally can look convincing while it is being fueled by short covering, tactical ETF demand, or relief from a falling dollar.
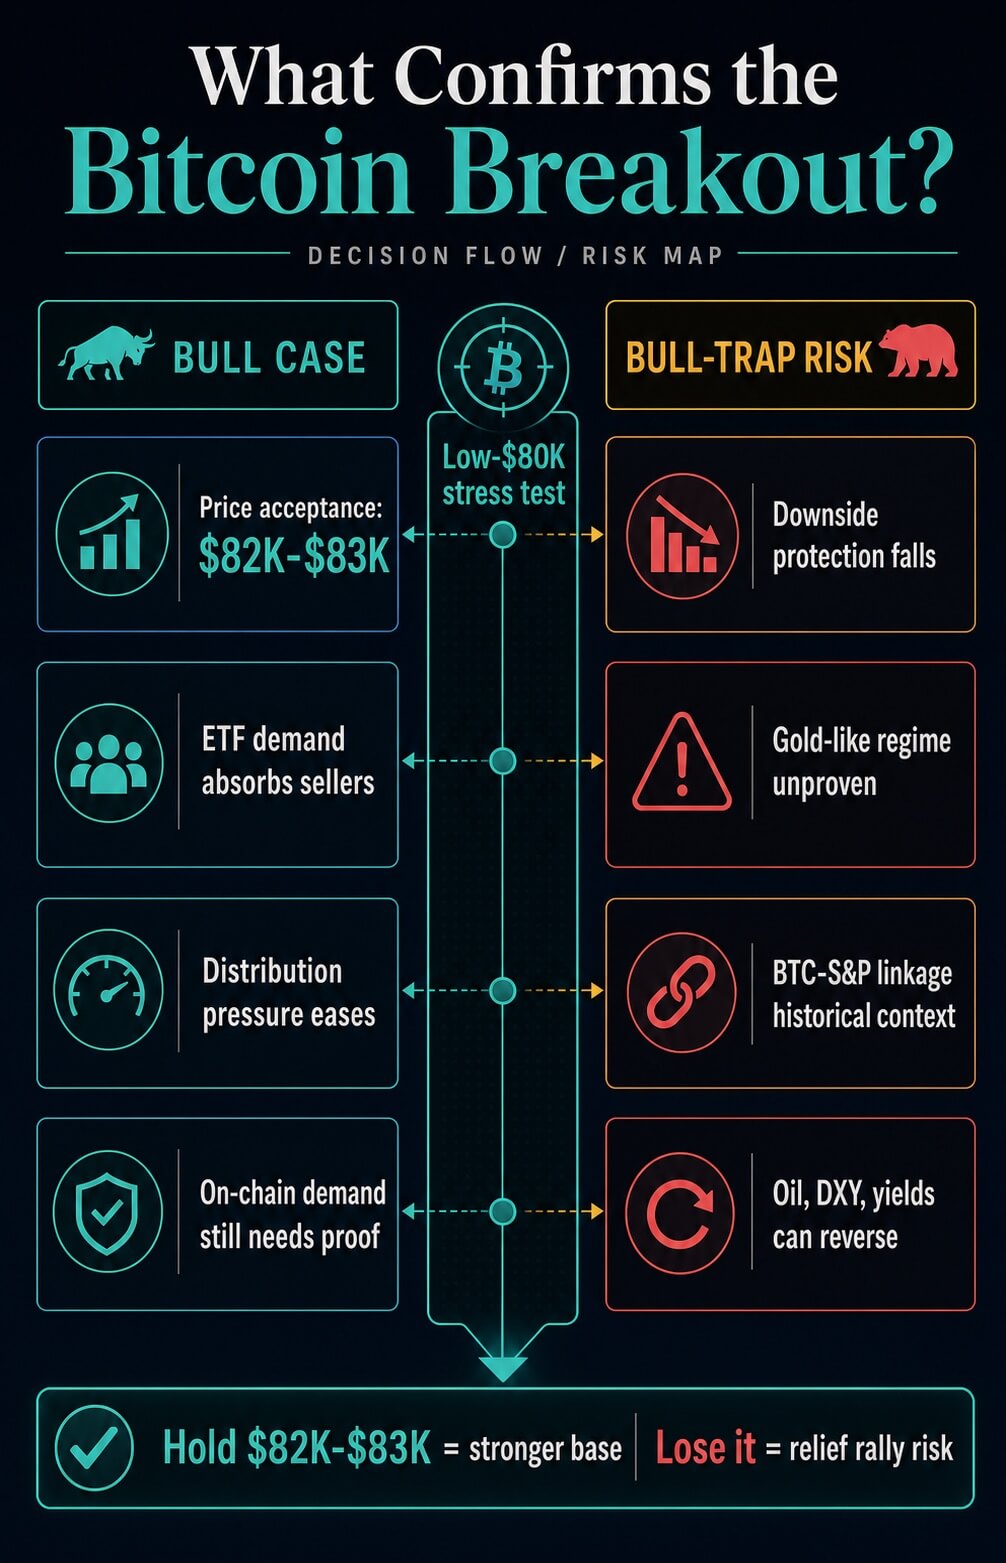
It becomes harder to dismiss only when several things happen together: price holds above resistance, ETF demand remains positive, distribution pressure eases, and downside protection falls because traders feel less need for it.
This is where the inflation-hedge debate needs restraint. Bitcoin's fixed supply and global liquidity make it a natural candidate for that story when oil, geopolitics, and the dollar drive price action.
But historical correlation data inside the Glassnode/Coinbase Q1 2026 report argues against declaring a gold-like regime too quickly.
The current setup reopens the hedge question and leaves the answer for later. If oil pressure returns and BTC continues to hold the low-$80,000 area while equities soften, the non-equity-bid argument strengthens.
If BTC fades as soon as the next macro headline turns, the move will look more like another high-beta risk rally than a real change in market identity.
The next test is whether the market accepts the low-$80,000 range after the relief trade cools. The $82,000-$83,000 area is important because CryptoSlate's ETF-demand analysis tied that band to the path toward a possible $90,000 breakout.
A failure to build support there would leave the latest rally as a test, short of confirmation.
The macro side has an equally clear trigger set. Oil staying below $100, DXY remaining weak, and yields staying away from the recent danger zone would keep pressure off risk assets.
A reversal in any of those could quickly expose whether BTC has real independent demand or was simply lifted by the same relief bid that carried equities.
The geopolitical layer makes that harder to model. Recent Iran and Strait of Hormuz headlines, including statements from President Donald Trump, have fed directly into the oil and risk-asset loop.
That is why the current Bitcoin move feels different from a normal chart breakout. A post, a ceasefire headline, or an oil-market repricing can change the bond, dollar, equity, and crypto read in the same session.
For now, the evidence supports a cautious middle ground. Bitcoin is showing strength at a level where a failed move would carry weight. ETF demand is giving the rally a real buyer base.
Macro volatility is making the hedge question relevant again. But the same source set still leaves the bull-trap risk open because on-chain and market-structure signals still trail price.
That makes $82,000-$83,000 the line to watch. Holding it would fall short of proving Bitcoin has become an inflation hedge again, but it would show that buyers can absorb selling above $80,000 while the macro picture keeps changing.
Losing it would point back to a simpler explanation: Bitcoin rallied with relief, then met the same bear-market supply waiting in the low-$80,000s.


 English (US) ·