 1 hour ago
4
1 hour ago
4
The bottom might be just around the corner, said Martinez.
Bitcoin’s price went through a highly volatile and mostly painful ride throughout June, dumping to a multi-year low first at $59,000 before another one at $58,000.
Analysts continue to debate whether this cycle’s bottom has been reached or not, but Ali Martinez recently published a post on his views about the current accumulation zone and whether it’s a proper entry level.
History Says Yes
In the post specifically designated to bitcoin’s 200-week Simple Moving Average (SMA), the popular analyst noted that the asset has rarely traded below it for a longer period. And when it has dipped below it, the subsequent rally has shown that those moments “have consistently marked exceptional long-term accumulation opportunities.”
Since the 200-week SMA currently sits at $63,500, a level that BTC lost earlier this week, Martinez concluded that “This is exactly when you want to deploy a dollar-cost averaging strategy.”
In the more detailed post on BTC’s market structure, though, the analyst admitted that bitcoin trading below the 200-week SMA doesn’t necessarily mean it has bottomed out. In fact, he noted that the asset can still dip further south and outlined potential targets at $54,000 or even $40,000. If that’s the case, investors might want to double down on their DCA strategy, he argued.
“Spreading buy orders across the $58,000 to $40,000 range allows you to build a position while the asset trades at a technical discount.”
Martinez believes $63,500 remains BTC’s most significant level now, as if it registers a “high-timeframe reclaim of the 200-week SMA as macro support,” it would suggest the early stages of a new bull run.
When Bottom?
Each leg down opens the door for analysts to continue the always-hot debate over whether the bottom is in or if more pain lies ahead. Martinez brought up BTC’s historical performance after the aforementioned 200-week SMA came into play. Each of his four examples delivered massive gains after bitcoin tested that level in 2015, 2018, 2020, and 2022.
You may also like:
- Prediction: Bitcoin Could Bottom Between $42K and $44K This Year
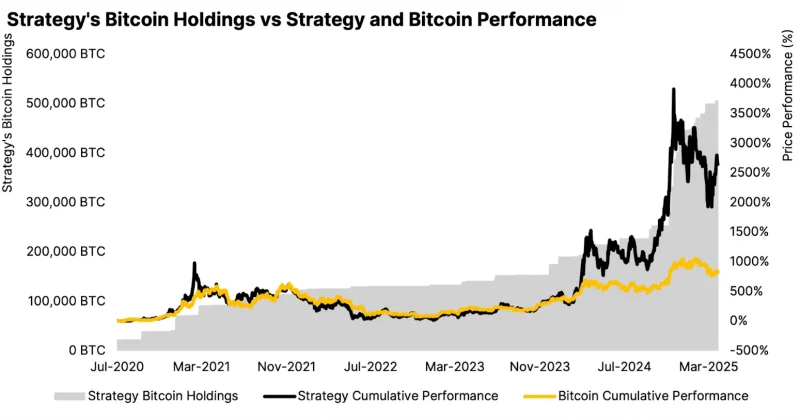
- MSTR’s Bitcoin Per Share Gets ‘Annihilated’ in Extreme Bear Case: Analyst
- Massive $11B End-of-Quarter Options Expiry Could Rattle Crypto Markets Today
As such, he determined that the bottom is “almost in” and outlined the precise gains registered from bottom to top.
-
August 2015: Bitcoin touched the 200-week SMA and launched a bull market, rallying over 8,500%.
- December 2018: A test of this moving average triggered a swift 267% recovery.
- March 2020: The COVID-induced liquidity flush saw Bitcoin validate the 200-week SMA as support before surging 1,125%.
- June 2022: For the first time ever, Bitcoin dipped and consolidated below the moving average until December 2022. Once the line was reclaimed, it initiated a 680% expansion.
Binance Free $600 (CryptoPotato Exclusive): Use this link to register a new account and receive $600 exclusive welcome offer on Binance (full details).
LIMITED OFFER for CryptoPotato readers at Bybit: Use this link to register and open a $500 FREE position on any coin!


 English (US) ·