 9 hours ago
4
9 hours ago
4
This article is for informational purposes only and does not constitute financial advice. Cryptocurrency investments carry a high degree of risk. Always conduct your own research or consult with a professional financial advisor before making any investment decisions.
Bitcoin price analysis for March 6, 2026, shows BTC testing the $70,000 level as ETF outflows and geopolitical tensions in Iran spark market volatility.

Bitcoin Price Analysis: The $70,000 Battleground
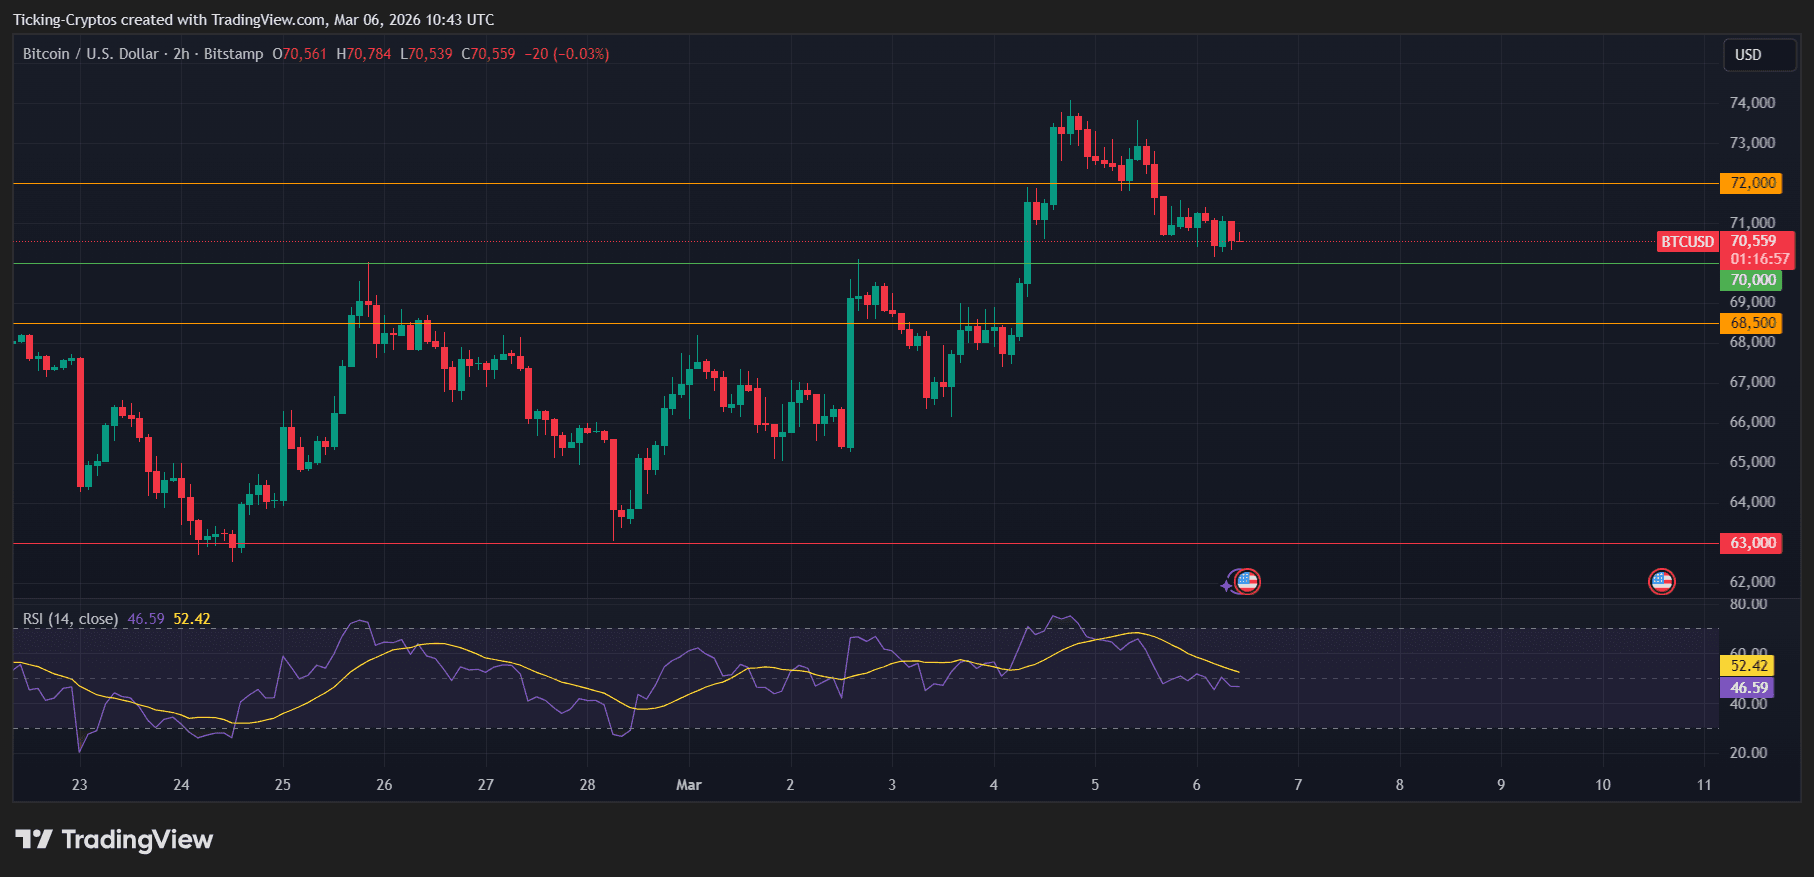
The $Bitcoin price is currently navigating a period of heightened volatility, trading at approximately $70,559 as of March 6, 2026. After a significant rally earlier this week that saw the premier cryptocurrency touch the $74,500 mark, a cooling-off period has settled in. This retracement is largely driven by a combination of profit-taking at psychological resistance levels and a shift in the macroeconomic landscape.
 Crypto Exchange Check: Who is the Test Winner? Get the Most Out of Your Investment
Why Is Bitcoin Crashing Today?
The primary catalyst for today’s downward pressure appears to be a reversal in institutional sentiment. Following three days of strong inflows, spot Bitcoin ETFs recorded a net outflow of over $227 million on Thursday. This suggests that institutional players are de-risking as geopolitical tensions in the Middle East—specifically involving Iran—continue to simmer, casting a shadow over "risk-on" assets.
Technical Outlook: Key Levels to Watch
From a technical perspective, the $BTC chart reveals several critical zones:
- Immediate Support: The $70,000 psychological level. A sustained close below this could trigger a move toward the $68,500 horizontal support.
- Major Resistance: The $72,000 to $74,000 range remains the primary obstacle for bulls.
- RSI Indicator: The Relative Strength Index (RSI) on the 2-hour chart is hovering near 46, indicating a neutral-to-bearish momentum as the market searches for a floor.
BTC Coin Analysis: Market Sentiment and Macro Factors
While the immediate price action is choppy, the broader crypto news cycle remains focused on the long-term resilience of the market. According to recent reports from S&P Global, Bitcoin's volatility is on a long-term downward trend as it integrates further into traditional financial systems. However, in the short term, it remains highly sensitive to the US Dollar Index (DXY) and interest rate expectations.
"Bitcoin is increasingly functioning as a hedge against long-term currency debasement, though it still behaves like a high-beta risk asset during sudden geopolitical shocks." — Market Analyst Insight.
 Tax season is right around the corner. Did you pick a crypto tax tool yet? Check out our comparison
ETF Dynamics and Institutional Flow
The impact of spot ETFs cannot be overstated. With BlackRock’s IBIT maintaining a dominant market share, the daily "flow" data has become the most watched metric for short-term traders. The recent flip to negative outflows has led some to fear a "dead-cat bounce," though others view this as a healthy consolidation after a 20% surge from February lows.
What’s Next for Bitcoin?
Investors should keep a close eye on the $70,000 mark. If Bitcoin manages to hold this level through the weekend, the stage could be set for another attempt at the $75,000 all-time high territory. However, if the "higher-for-longer" interest rate narrative gains more steam following upcoming employment data, we might see a deeper retest of the $63,000 baseline.


 English (US) ·