 1 hour ago
1
1 hour ago
1
Bitcoin continues to trade within a broader recovery structure following the strong rebound from the $60K region. However, despite the recent bullish momentum, the market has been struggling to reclaim a decisive resistance zone at the $80K region, where the next major directional move is likely to emerge.
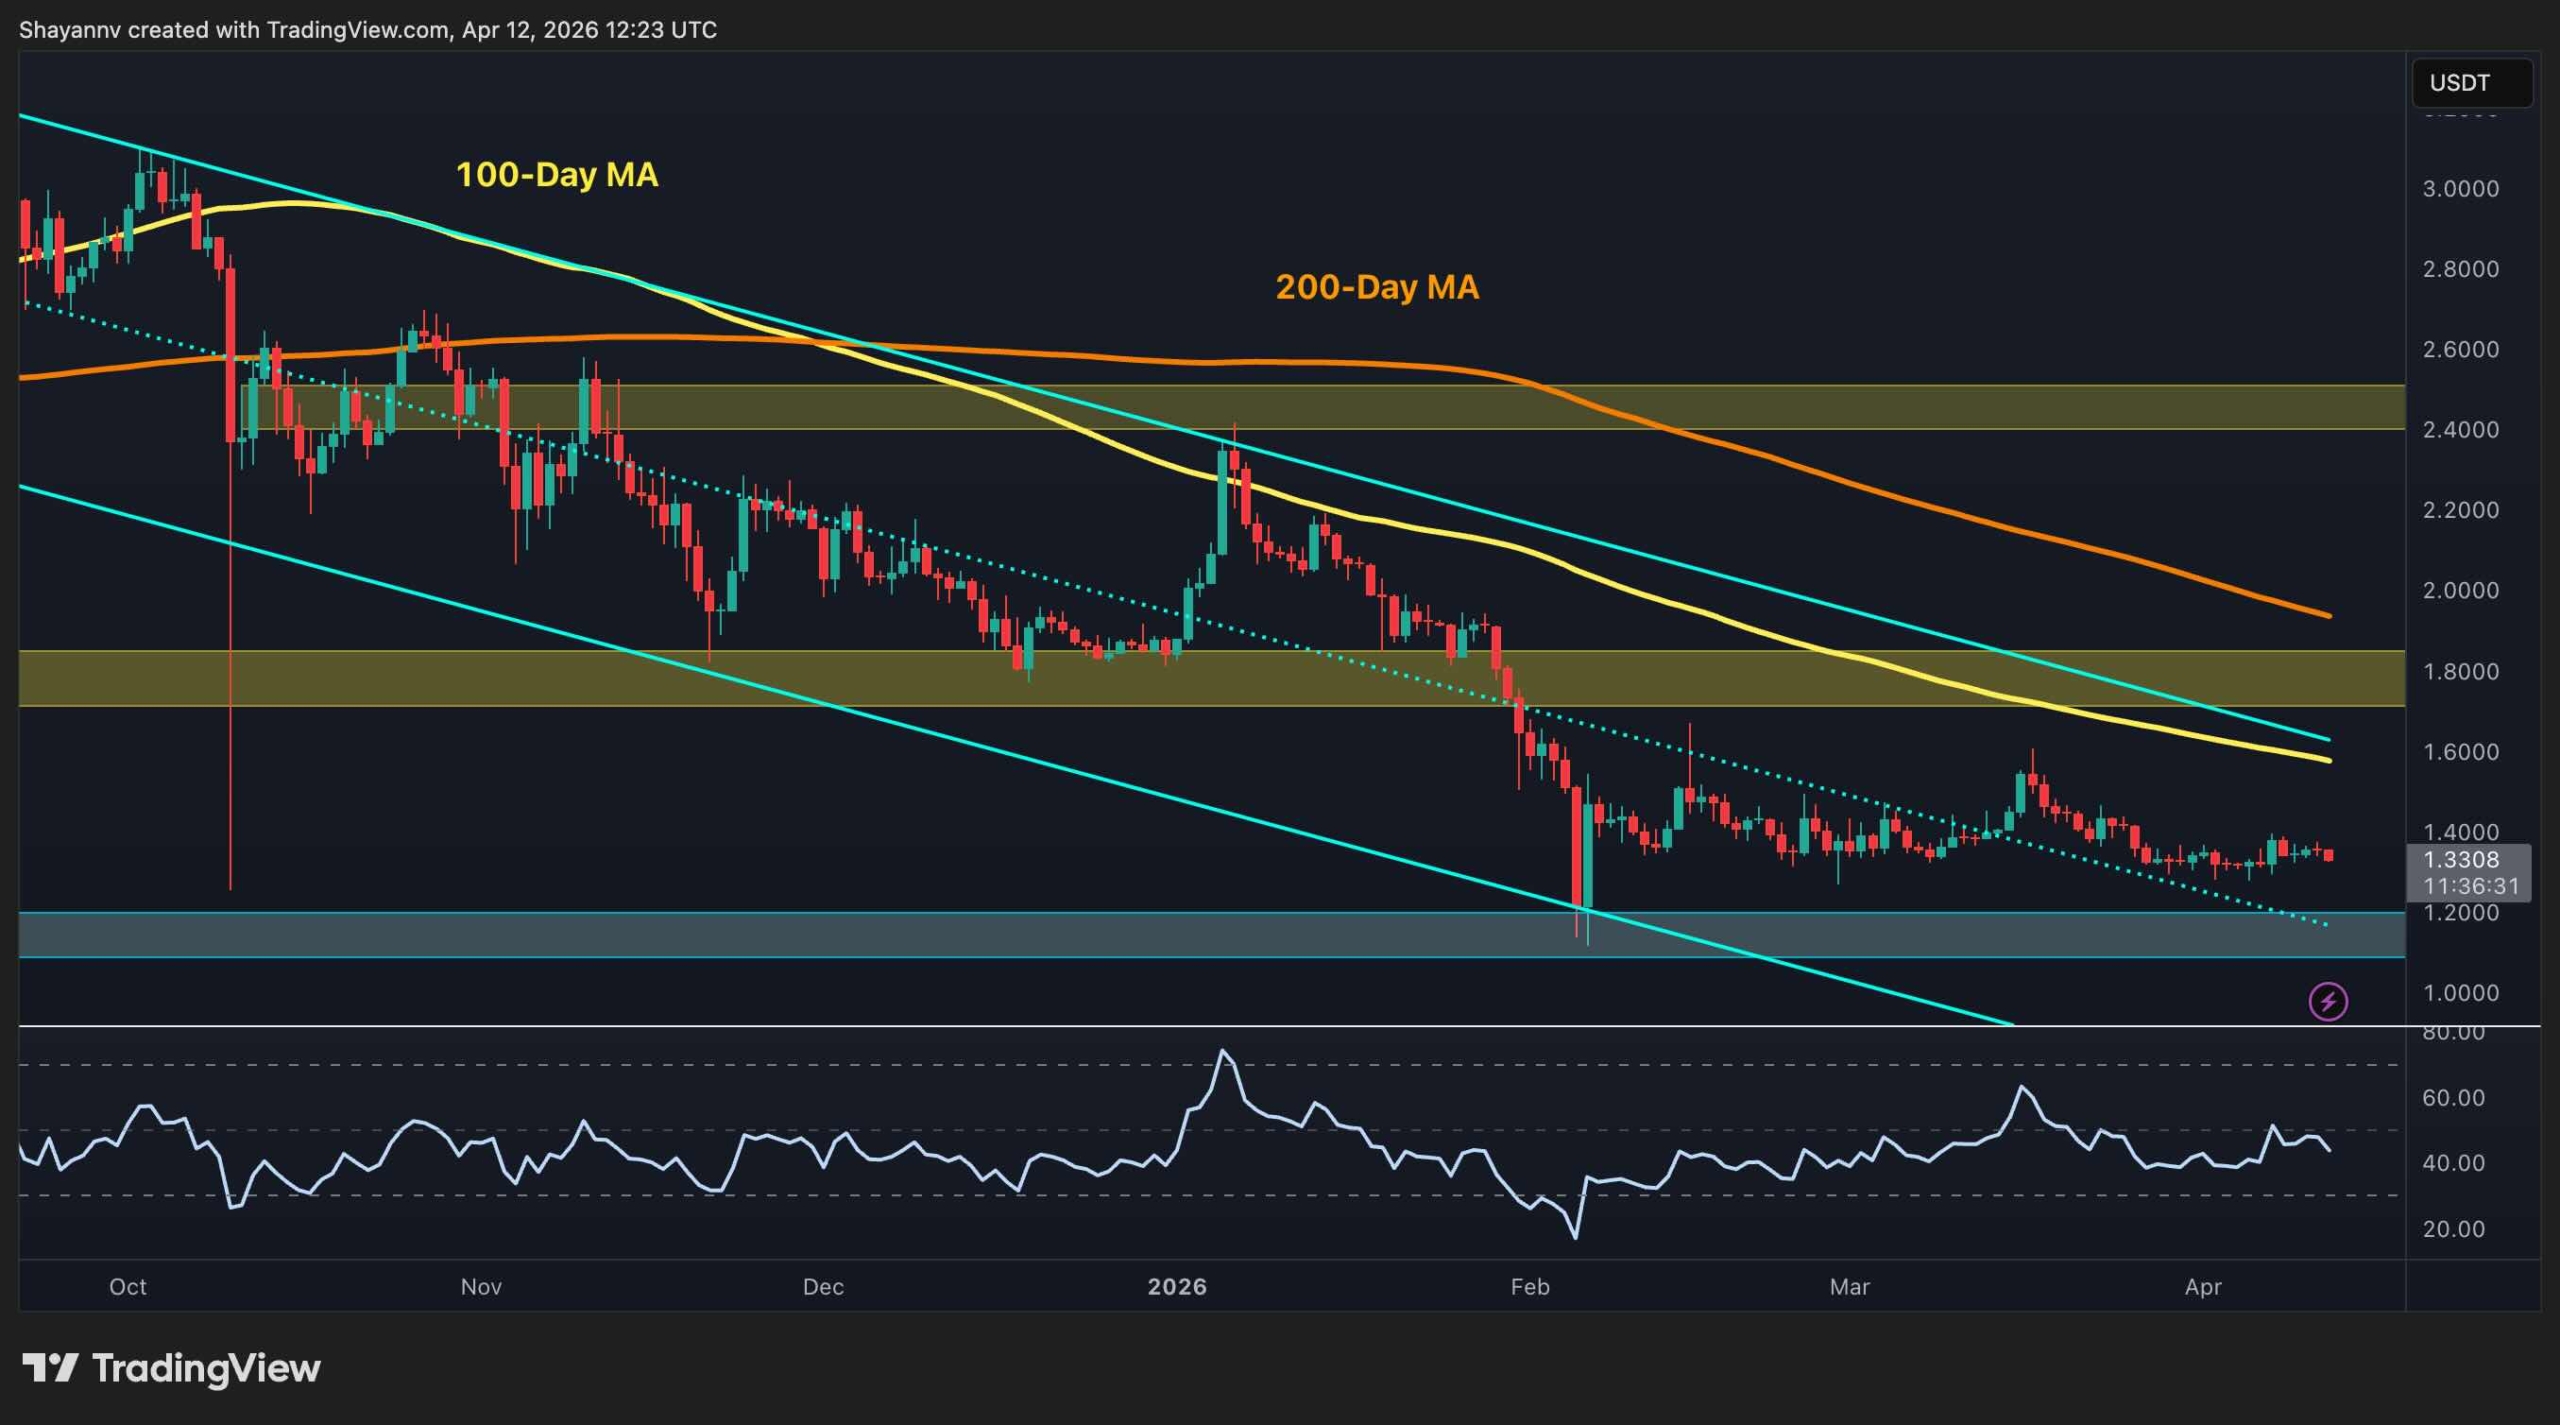
Bitcoin Price Analysis: The Daily Chart
On the daily timeframe, BTC has been recently experiencing choppy price action near the crucial $80K resistance region, while lacking sufficient bullish momentum for a confirmed breakout. This area carries substantial technical importance as it aligns with the 100-day moving average, strengthening seller presence around current levels.
Recent candles reflect increasing hesitation and fading momentum as the market struggles to establish acceptance above this threshold. Based on the current structure and the repeated rejection attempts around the $80K-$82K range, the probability of a bearish reversal appears slightly higher in the short term.
Nevertheless, if buyers unexpectedly manage to push the price above both the 100-day MA and the upper boundary of the price channel, a fresh short-squeeze scenario could unfold, potentially driving BTC toward the major $90K resistance region.

BTC/USDT 4-Hour Chart
On the 4-hour chart, Bitcoin remains trapped within a tight consolidation range bounded by the ascending dynamic trendline from below and the static $80K-$83K resistance zone overhead. This structure reflects a temporary equilibrium between buyers and sellers following the recent impulsive rally.
As long as the price remains confined within this range, further sideways consolidation is likely. However, the ascending trendline near the $78K level currently acts as the key short-term support for buyers. A bearish rejection and breakdown below this trendline could trigger a corrective decline toward the lower order block regions around the $75K-$76K and potentially the $70K-$71K support area.

Onchain Analysis
From an on-chain perspective, the realized price of long-term holder cohorts continues to act as one of the market’s most important macro support and resistance indicators. These realized price levels are crucial because they determine whether specific holder cohorts remain in overall profit or loss, significantly influencing their market behavior.
Currently, Bitcoin is trading between the realized price bands of the 12-month to 2-year cohorts, positioned approximately between $62K and $92K. Historically, remaining above these realized price levels reflects stronger holder confidence and reduced sell-side pressure, while losing them often leads to broader market weakness. As a result, this range remains highly significant for determining Bitcoin’s next macro trend direction.

Prefer CryptoPotato on Google News - Never miss a breaking move
Binance Free $600 (CryptoPotato Exclusive): Use this link to register a new account and receive $600 exclusive welcome offer on Binance (full details).
LIMITED OFFER for CryptoPotato readers at Bybit: Use this link to register and open a $500 FREE position on any coin!
Disclaimer: Information found on CryptoPotato is those of writers quoted. It does not represent the opinions of CryptoPotato on whether to buy, sell, or hold any investments. You are advised to conduct your own research before making any investment decisions. Use provided information at your own risk. See Disclaimer for more information.


 English (US) ·