 1 hour ago
1
1 hour ago
1
Bitcoin has entered a delicate phase. It is testing the lower boundaries of its recent consolidation after a significant retracement from late-2025 highs. Market structure now suggests a potential accumulation zone is forming, with short-term swings contained within a widening channel.
However, volatility remains elevated, and the coming sessions can be crucial for determining whether BTC can form a bottom above $60k or if further downside toward the $50k support cluster or lower will materialize.
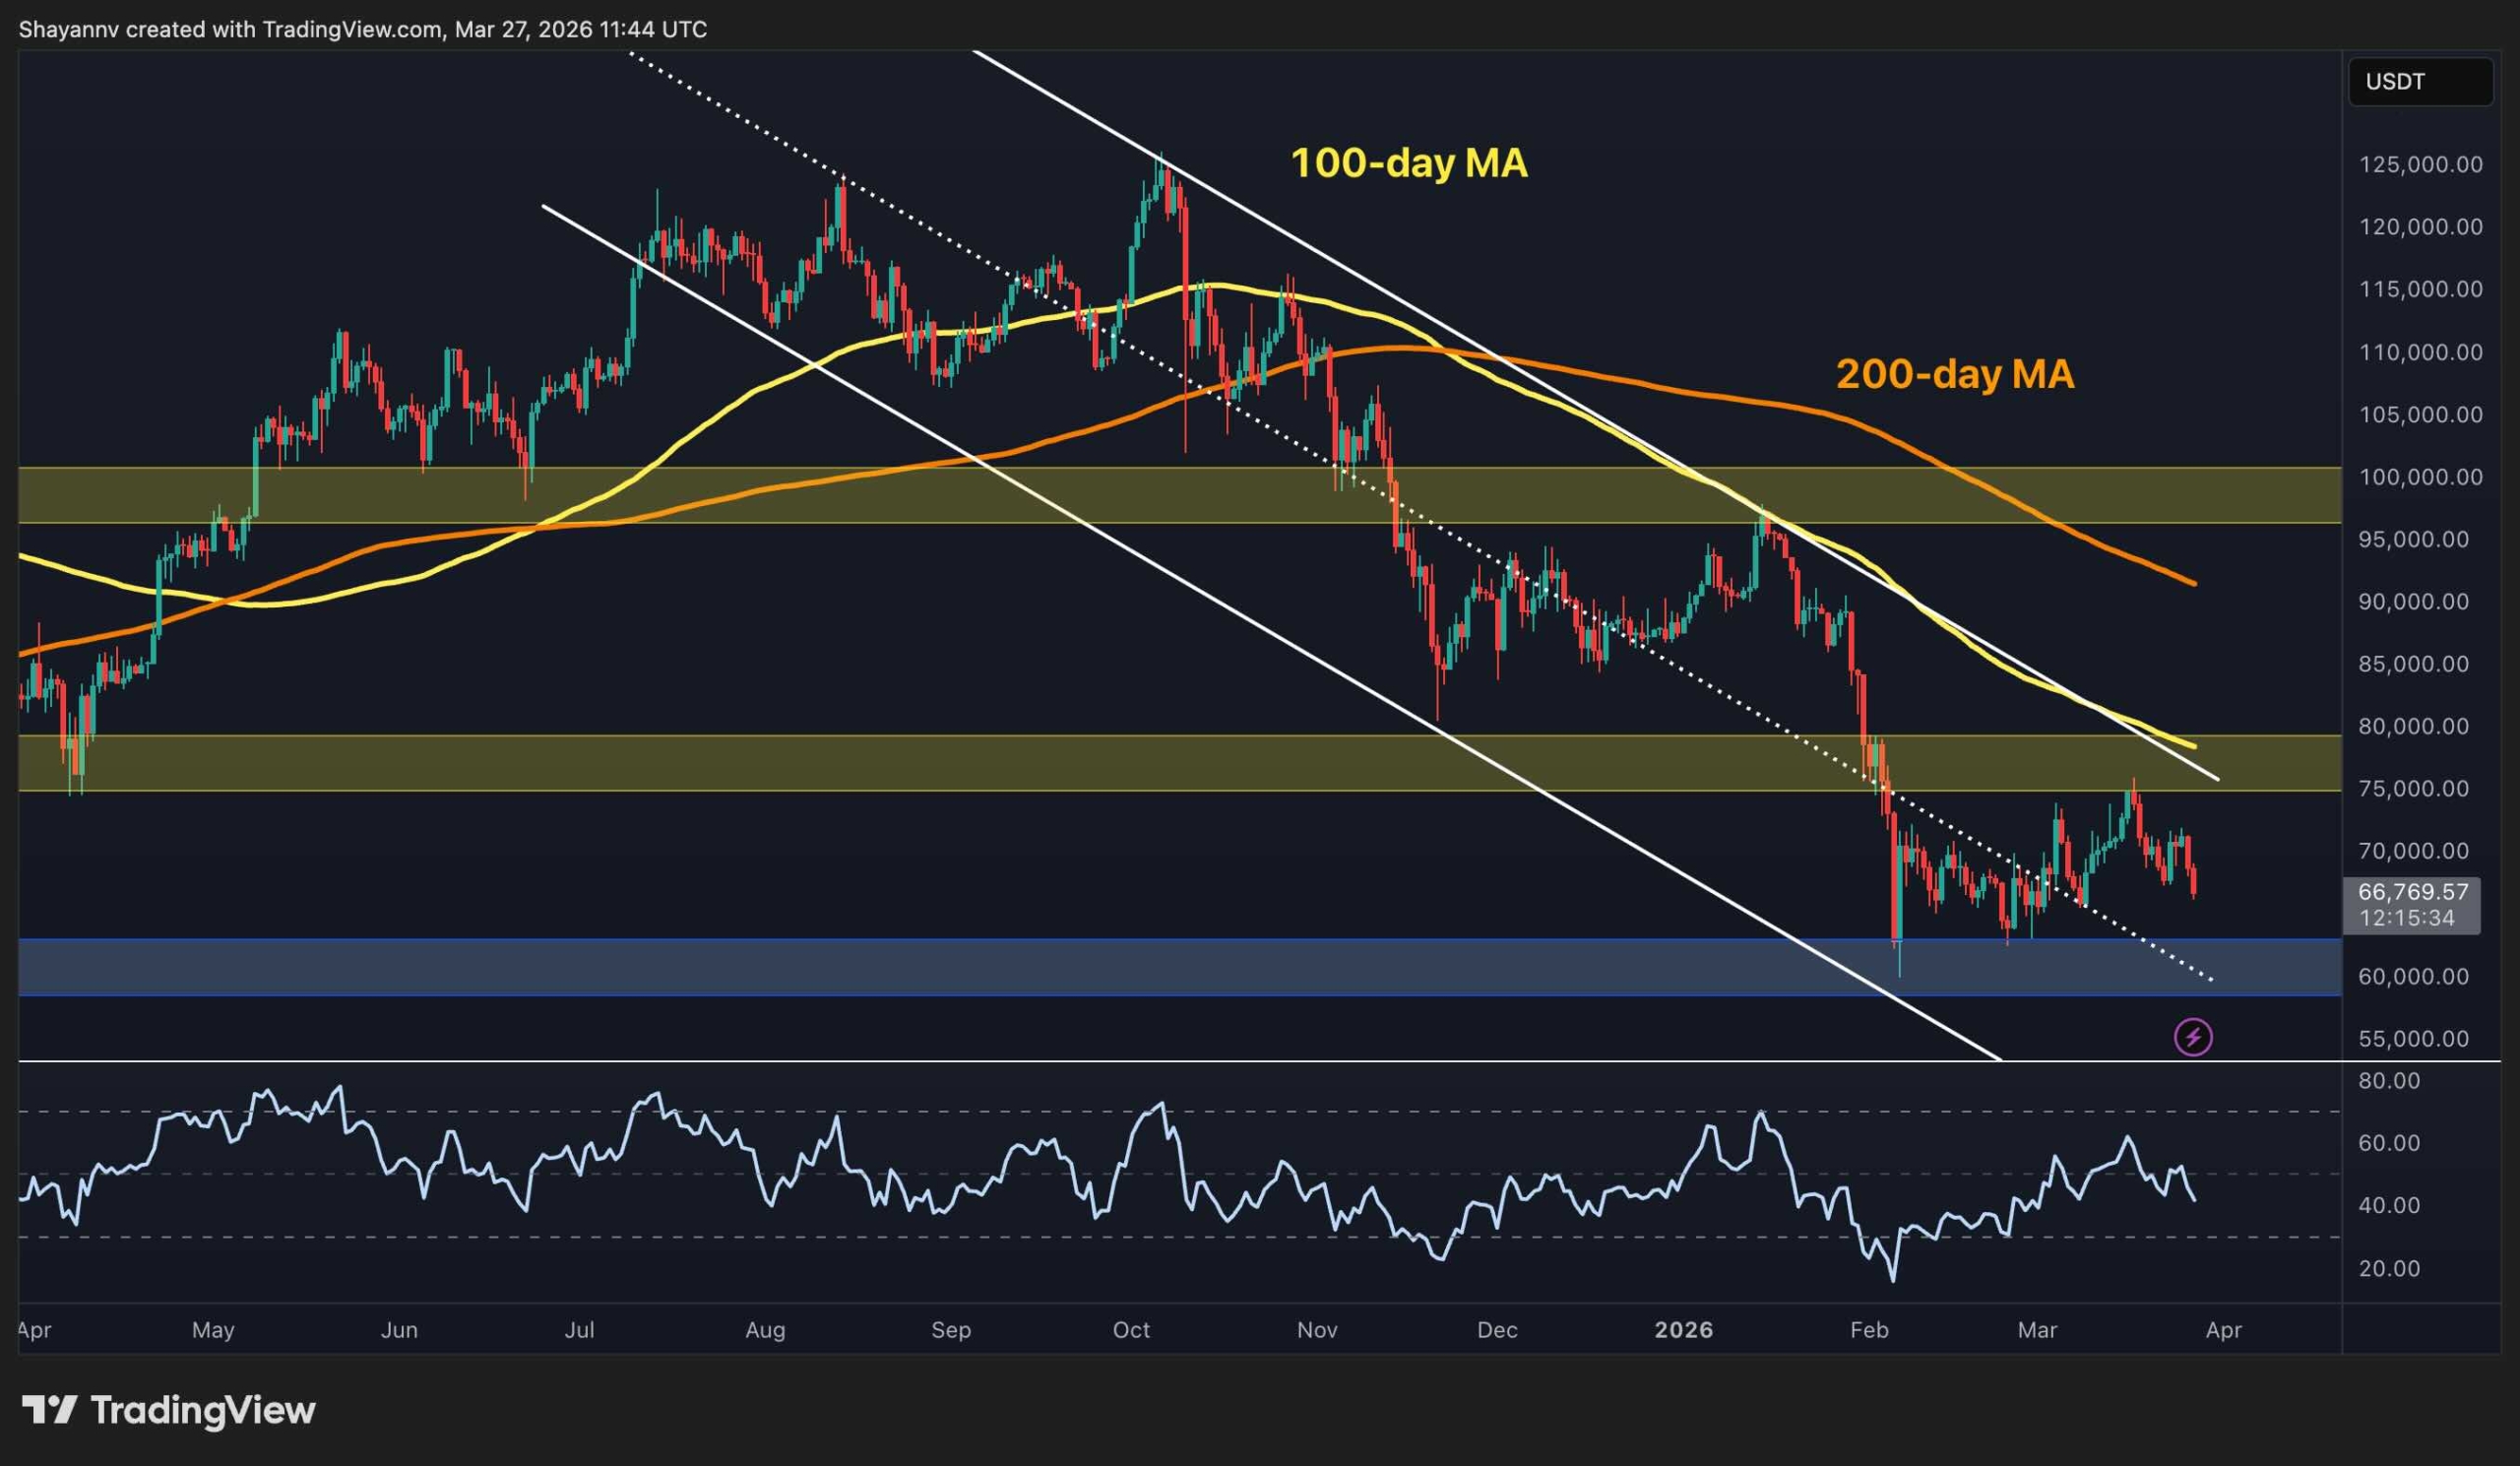
Bitcoin Price Analysis: The Daily Chart
On the daily timeframe, BTC is showing mixed signals. The price remains below both the 100-day (yellow, ~$80k) and 200-day (orange, ~$90k) moving averages, and inside a wide descending channel. This confirms a bearish medium-term trend. Yet, the current consolidation is forming just above a strong support zone around $60k, which coincides with previous liquidity and demand areas.
The RSI has also recovered from deep, oversold levels near the bottom of the range, but is once again on the decline following the recent rejection from the $75k resistance zone. Therefore, with the price accelerating lower, another test of the critical $60k demand zone is likely in the coming days, and BTC’s trend in the short to medium-term depends heavily on the market’s reaction at this level.
BTC/USDT 4-Hour Chart
Zooming in on the 4-hour chart, it is evident that BTC has been forming an ascending channel, which is more similar to a large bearish flag. The asset has also been consolidating in the wide range between $60k and $75k for the past couple of months, being bounded by both the channel boundaries and significant support and resistance levels.
The recent rejection from the $75k level is clearer on the 4-hour chart, as the short-term market structure has clearly shifted bearish after a failed breakout above the channel and the horizontal resistance area. This has led to a rather steep decline in recent days, toward the lower boundary of the channel, which is on the verge of breaking down at the moment.
With the RSI also sitting low, near the oversold region, the short-term outlook does not look good for buyers, as a channel breakdown with momentum could lead to another drop toward the $60k zone and make the market anxious once again.

On-Chain Analysis
On-chain metrics highlight a key aspect of the current cycle. The LTH-SOPR/STH-SOPR ratio has fallen to levels below one, reaching values comparable to those observed during the accumulation phase at the end of the last market cycle in 2023.
For context, the LTH/STH SOPR ratio measures the profit realization of long-term holders (LTH) relative to short-term holders (STH). So, a ratio below 1 indicates LTHs are selling at a loss or just breaking even, while STHs are under significant pressure.
Historically, such depressed readings have coincided with market bottoms and strong accumulation periods. This suggests that the current decline in the metric may reflect capitulation from weaker hands while more patient investors accumulate BTC within the ongoing range, potentially laying the foundation for the next bullish leg.
Yet, this signal should also be accompanied by a positive price action soon, as even the strongest hands cannot hold on forever in a massive drawdown.

Binance Free $600 (CryptoPotato Exclusive): Use this link to register a new account and receive $600 exclusive welcome offer on Binance (full details).
LIMITED OFFER for CryptoPotato readers at Bybit: Use this link to register and open a $500 FREE position on any coin!
Disclaimer: Information found on CryptoPotato is those of writers quoted. It does not represent the opinions of CryptoPotato on whether to buy, sell, or hold any investments. You are advised to conduct your own research before making any investment decisions. Use provided information at your own risk. See Disclaimer for more information.


 English (US) ·