 1 month ago
31
1 month ago
31
The cryptocurrency market is currently witnessing a significant shift in momentum. After a period of heightened volatility, the Bitcoin price has retreated to the $65,000 level, marking a crucial cooling-off period for the world's largest digital asset. This move comes as traders digest recent macro data and institutional shifts, leading to what analysts describe as a "textbook consolidation."
Is the Bitcoin Price Still Bullish?
Yes, the broader structure remains intact, but the short-term outlook has shifted to neutral-bearish. While the drop to $65,000 has sparked concern among retail investors, technical indicators suggest this is a necessary "healthy correction" to shake out over-leveraged positions before any potential move toward previous highs.
Bitcoin Price Today: Understanding the $65K Support
The recent price action on the BTC-USD chart indicates that the $65,000 region is acting as a primary psychological and technical floor.
Why did Bitcoin drop?
Several factors have contributed to this retracement:
- Institutional Profit Taking: After a strong start to 2026, many institutional desks are locking in gains.
- Macro Uncertainty: New tariff announcements and shifts in Federal Reserve expectations have pushed investors toward defensive assets like gold.
- Whale Activity: On-chain data from platforms like Glassnode shows an increase in exchange inflows from large-scale holders, signaling a temporary distribution phase.
Bitcoin Price Analysis: Consolidation or Breakdown?
Analyzing the recent 4-hour and daily charts reveals a clear descending channel pattern. Bitcoin recently peaked near $70,000 before easing back to its current range.
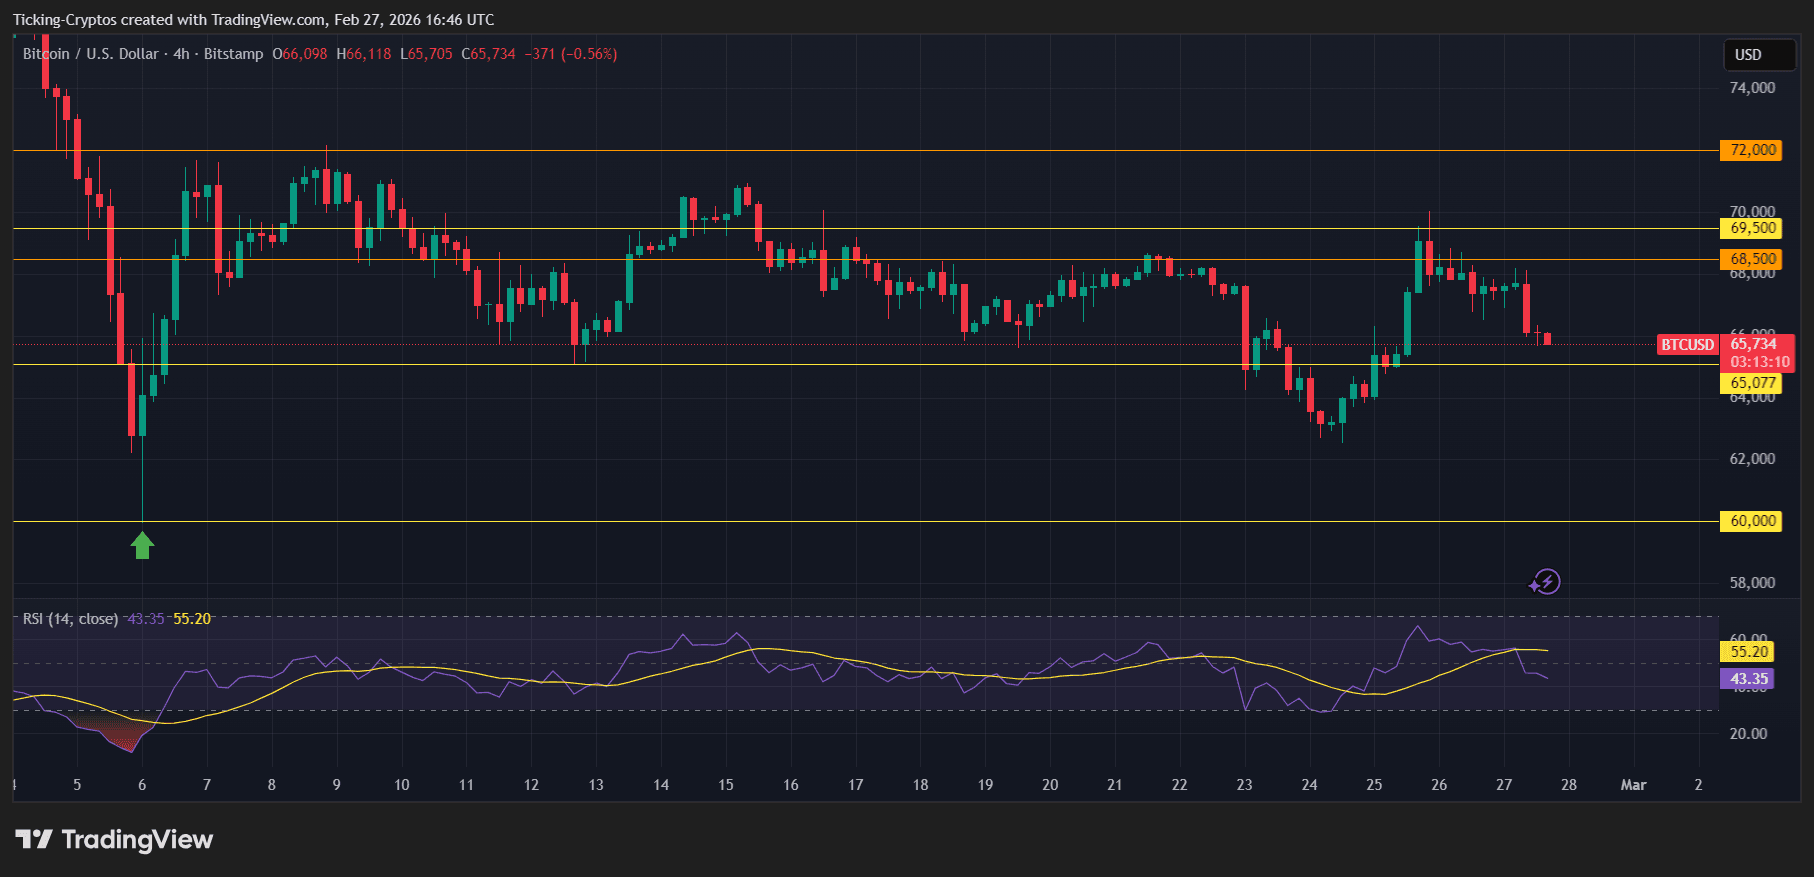
Key Technical Indicators:
- RSI (Relative Strength Index): The RSI is currently hovering around 45, indicating that Bitcoin is neither oversold nor overbought. This "middle-ground" supports the narrative of a sideways consolidation.
- Support and Resistance:
- Immediate Support: $65,000 (Psychological)
- Strategic Support: $62,000 (100-week Moving Average)
- Near-term Resistance: $68,500 (20-day EMA)
- Volume: Trading volume has stabilized, which is typical during a consolidation phase. A sudden spike in volume at these levels would be required to confirm a breakout in either direction.
Bitcoin Price Prediction: Where is BTC Price Heading?
Predicting the next move for Bitcoin requires looking at both liquidity and sentiment. Currently, the Fear & Greed Index is in "Extreme Fear" territory. Paradoxically, for contrarian traders, this often signals a potential bottoming process.
Scenario A: The Bullish Rebound
If Bitcoin can maintain its footing above $64,200 and break the $68,000 resistance, the next targets are $71,500 and eventually the $75,000 psychological barrier. This would likely be driven by renewed spot ETF inflows.
Scenario B: The Bearish Extension
A decisive daily close below $62,000 would be concerning. Such a move could trigger a "liquidity cascade," potentially pushing prices toward the $58,000 support zone, which served as a major floor in late 2024.


 English (US) ·