Bitcoin (BTC) price dropped to $79,800 on Thursday after being rejected at a key dynamic resistance level. The pullback occurred despite the weekly spot Bitcoin exchange-traded fund (ETF) inflows surging past $1 billion for the first time since January, but technical data suggests the correction may be short-lived.
Bearish divergences point to where BTC price may go
Bitcoin’s dip below $80,000 came amid a bearish divergence in the relative strength index (RSI) on the one-hour and four-hour charts. A bearish divergence occurs when BTC forms higher highs while the RSI weakens across lower timeframes, signaling fading buying momentum during a rally.
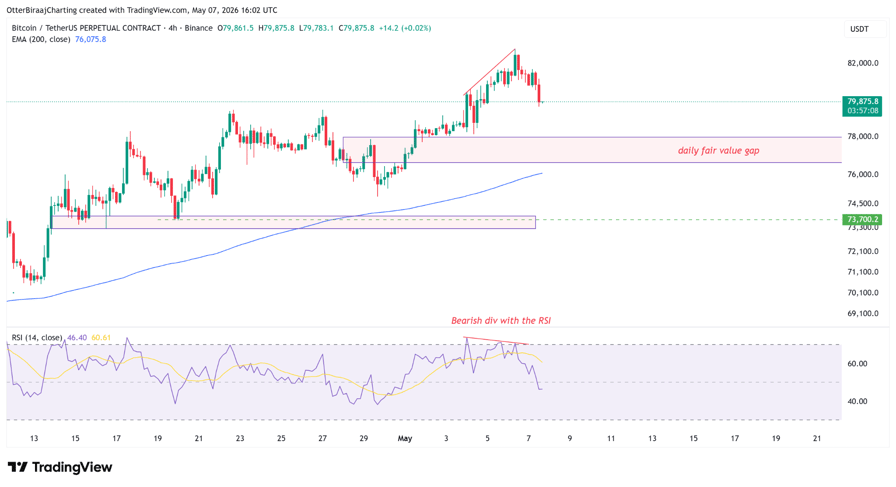
BTC/USDT, four-hour chart. Source: Cointelegraph/TradingView
A hold above the weekly open at $78,500 could stabilize the short-term price action. The key technical support range remains between $76,000 and $78,000, where the daily fair value gap (FVG) aligns with Bitcoin’s 200-day exponential moving average (EMA). If the correction continues, BTC could retest the FVG zone before attempting another rebound above its recent high at $82,800.
A fair value gap marks an area where a sharp price movement previously occurred with limited trading activity, leaving an imbalance that often becomes a liquidity zone during retracements.
Crypto trader Jelle said the “200-day MA/EMA cluster” was acting as resistance, while also identifying $78,000 as the first major support area. According to Jelle, a 200-day moving average retest could allow Bitcoin to retest higher price targets.
Meanwhile, crypto trader Killa XBT identified the $76,300 to $74,700 range as a deeper support zone if selling pressure continues. The trader pointed to the weekly open near $78,500 as the main short-term level that bulls are attempting to defend.
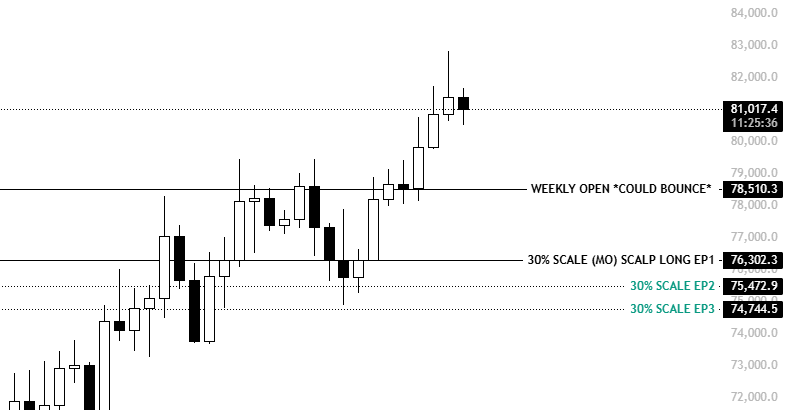
BTC one-day chart analysis by Killa. Source: X
Related: Bitcoin analysts say this level must break for BTC price to confirm bottom
Can spot ETF inflows offset price weakness?
Spot Bitcoin ETF demand strengthened sharply this week. Net inflows reached $1.05 billion, marking the strongest weekly intake since the third week of January. A positive close on Friday would confirm the largest weekly ETF inflow return in nearly four months.
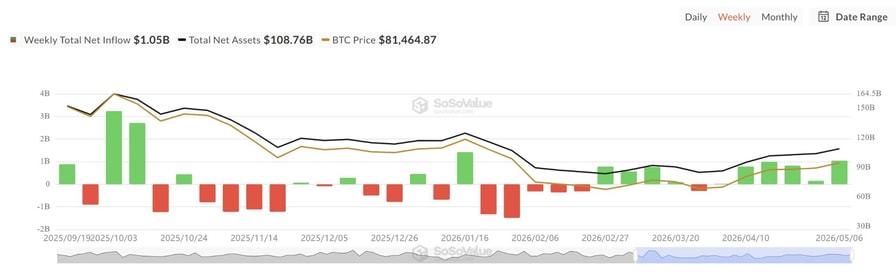
Spot BTC ETF net inflows. Source: SoSoValue
Meanwhile, Swissblock data shows that the Bitcoin Risk Index has reset to near zero, while ETF net flows turned positive again at roughly 3,000 BTC. Historically, elevated risk readings aligned with the ETF outflows and heavier selling pressure across the market.
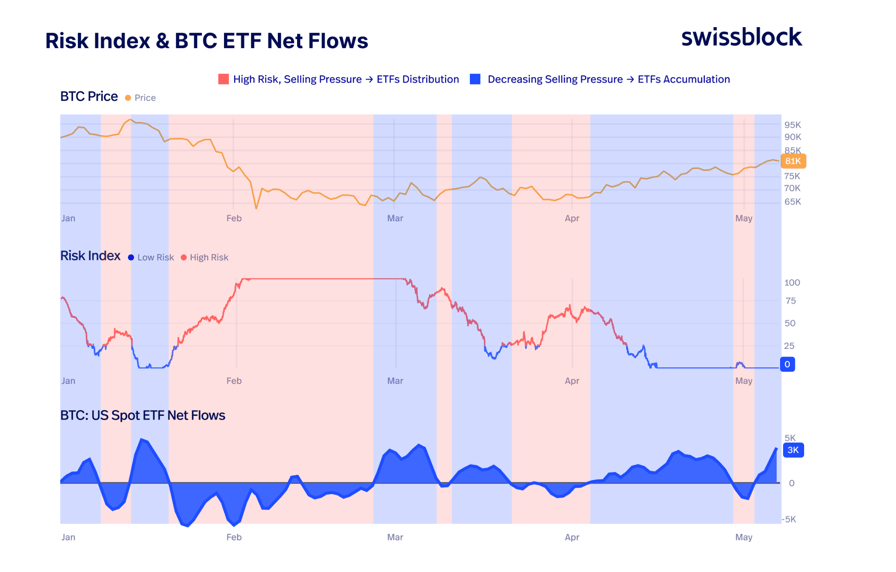
Risk index and BTC ETF net flows. Source: Swissblock/X
The resets into the low-risk zone often coincided with renewed accumulation near the major support clusters. The analysis added,
“That synchronization is still in place. Even when the Risk Index ticked slightly higher last week, ETF selling appeared briefly, but accumulation quickly resumed. That tells us ETF demand is absorbing selling pressure. This remains a flow-driven breakout.”Related: Bitcoin market dominance moves above 61%: Will altcoins follow?
This article is produced in accordance with Cointelegraph's Editorial Policy and is intended for informational purposes only. It does not constitute investment advice or recommendations. All investments and trades carry risk; readers are encouraged to conduct independent research.


 English (US) ·