Bitcoin’s recent price moves have closely followed a two-year Fibonacci model. According to analyst CryptoCon, the next logical level could be around $166,000.
Summary
- Bitcoin has consistently followed Fibonacci extension levels since bottoming at $15,500 in late 2022, with key pauses at $30,362, $46,831, $71,591, and $109,236.
- Crypto analyst CryptoCon projects $166,754 as the next logical level based on the 5.618 Fibonacci extension, which fits the cycle’s prior 52–54% spacing pattern.
- Institutional demand, particularly from U.S. spot Bitcoin ETFs now holding nearly $150 billion in assets, continues to support upward price pressure.
- Analysts warn of possible short-term pullbacks, with seasonal data showing September corrections in past cycles and sentiment metrics suggesting increasing profit-taking.
Fibonacci’s fingerprints on Bitcoin’s rise
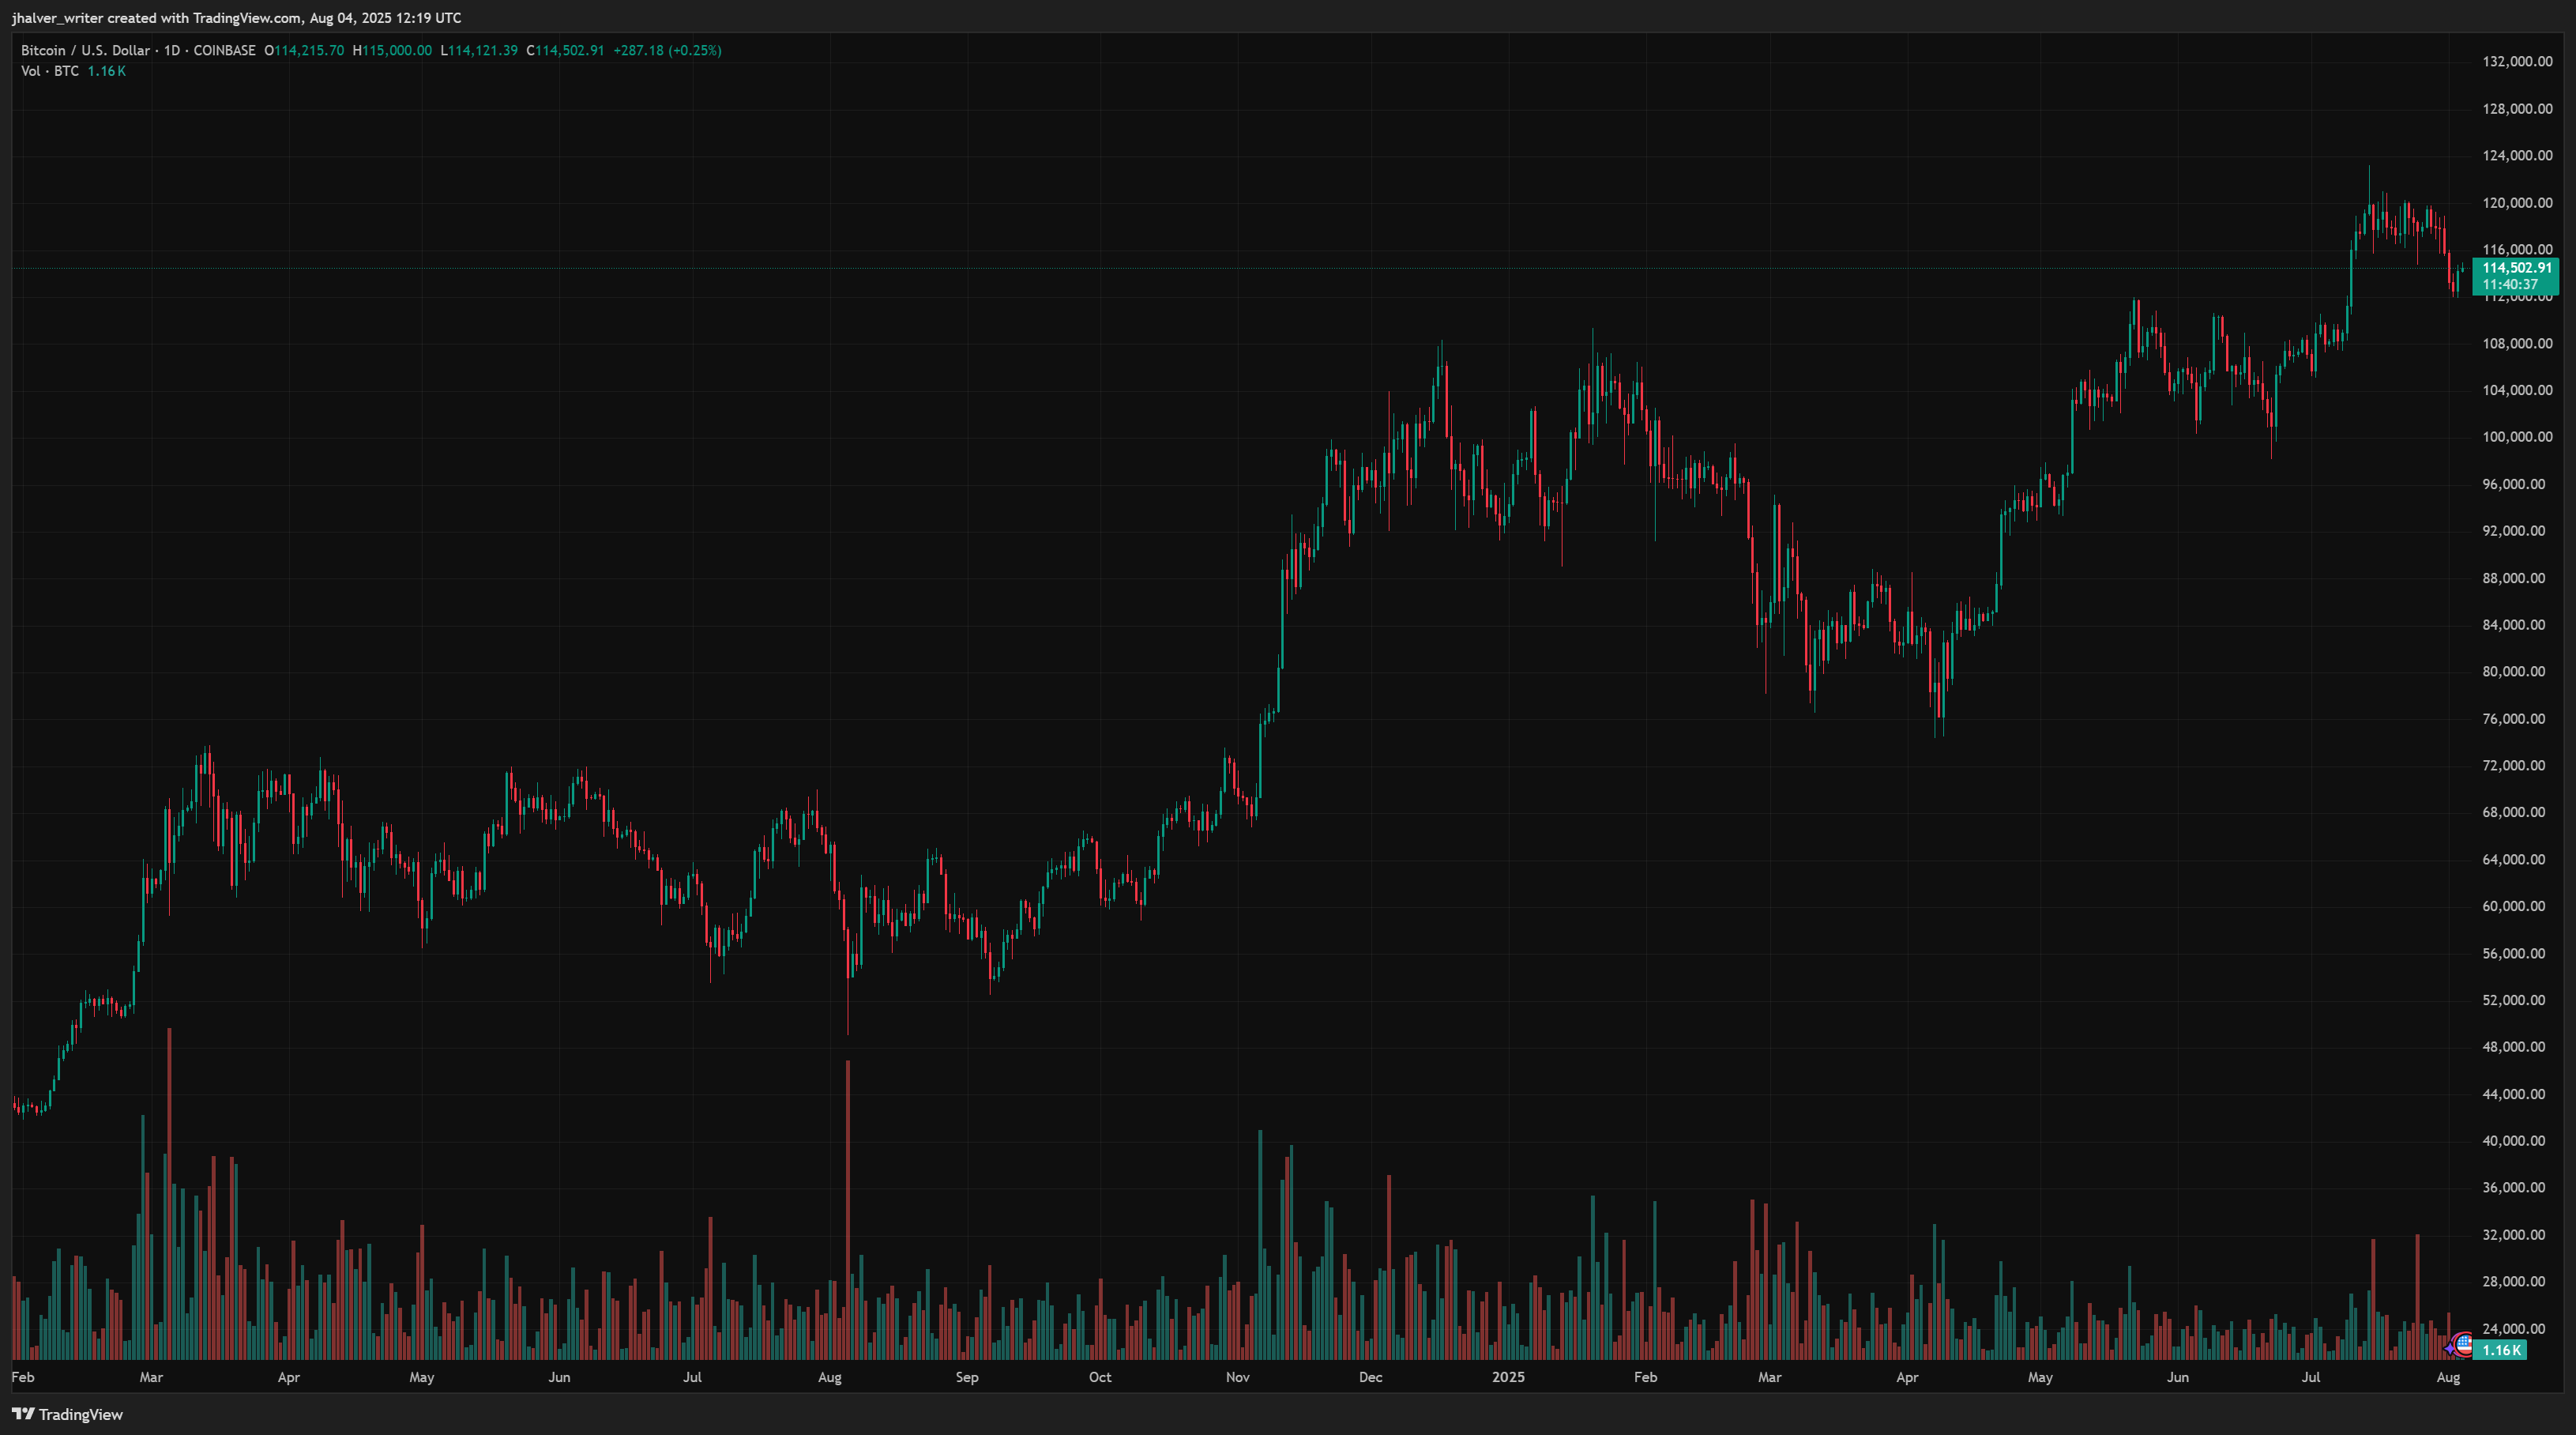
Bitcoin’s (BTC) recent all-time high near $123,000 has triggered all the usual market questions. Some think the top is in. Others believe there is more room to grow.
As of this writing on Aug. 4, BTC has dropped to around $114,500, down about 7% from its recent peak and approximately 4% over the past seven days.
 BTC price chart | Source: crypto.news
But, CryptoCon, a widely followed analyst, believes Bitcoin is following a repeating pattern based on Fibonacci extensions. His model offers a path that Bitcoin has already followed for nearly two years. And if that path continues, the next destination may not be a surprise at all.
During every Bitcoin decline, people start to fear the worst.
I see 123k here, which is not $166,754.
Every breakout this cycle has led to the perfect retest of a .618 extension.
The 5.618 is inevitable! pic.twitter.com/mAFqT8mIMm
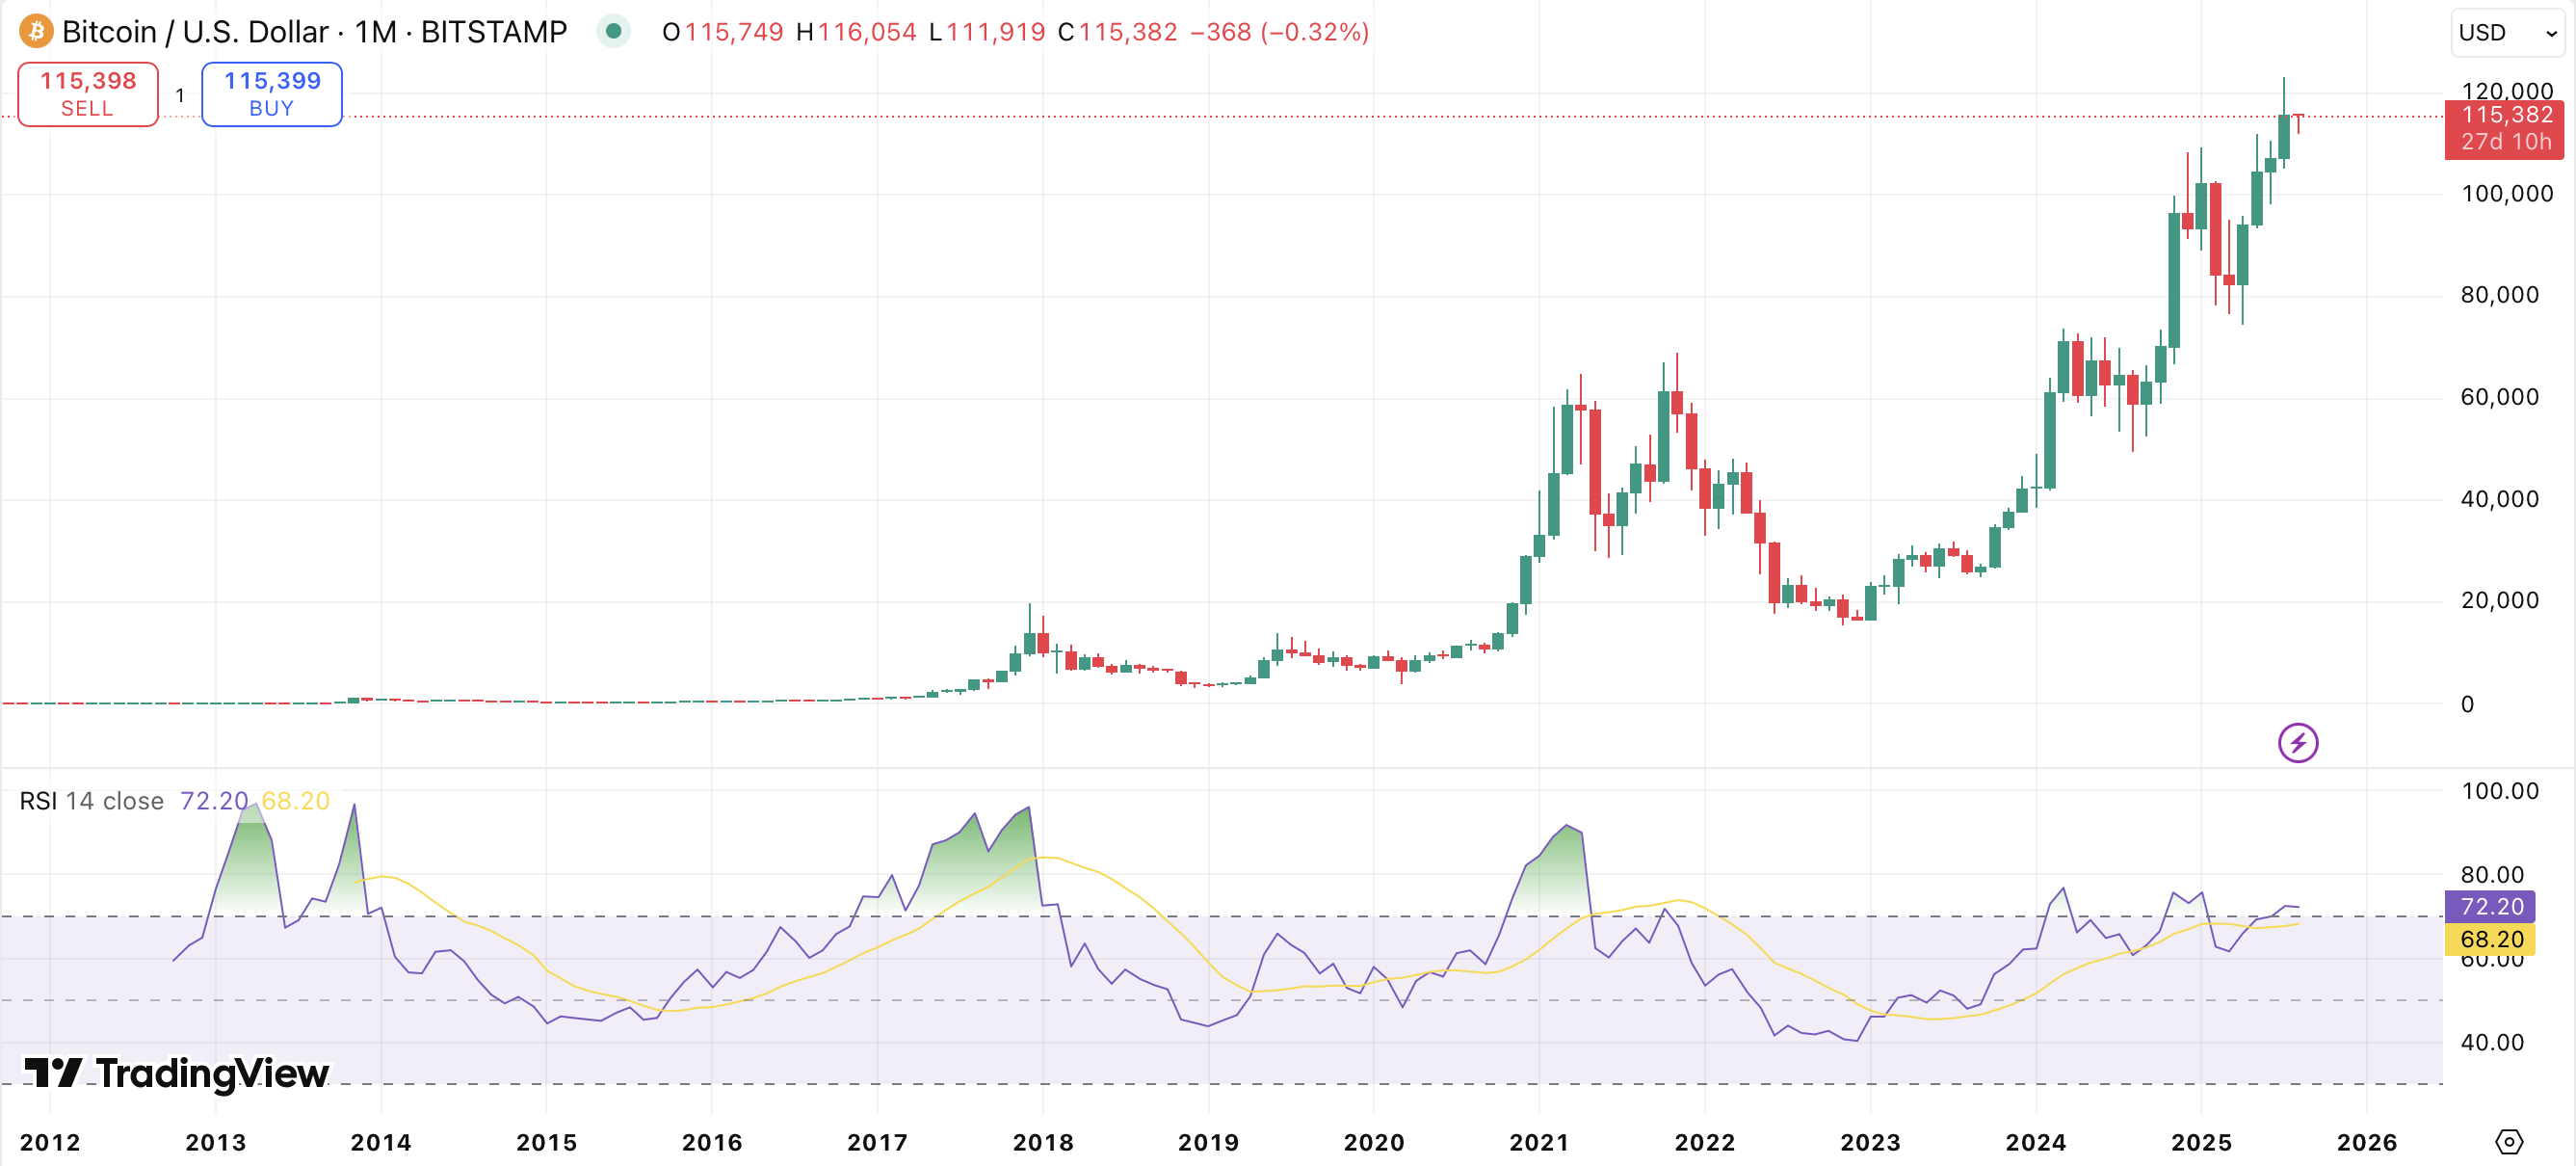
The story starts in late 2022, when Bitcoin fell to around $15,500 after the FTX collapse. That was the low point of the current cycle. CryptoCon calls this Retrace Point Zero.
From there, Bitcoin began climbing in stages. In April 2023, BTC reached around $30,362, which aligned with the 1.618 Fibonacci extension. It paused around that level, moved sideways for a few months, then climbed again.
In January 2024, it touched $46,831, matching the 2.618 extension and after a small pullback, Bitcoin held that level as support.
Two more key levels followed. In March and June 2024, Bitcoin touched the 3.618 extension at $71,591, failing to break through both times. It consolidated, just like it had at earlier Fibonacci levels.
Then, in January 2025, it broke past that zone and reached $109,236, which matches the 4.618 extension. BTC’s recent high of $123,000 stands above that level but below the next. And importantly, $123,000 is not a Fibonacci extension. It is in between.
According to CryptoCon, this makes it a transition zone. If the pattern continues, the next logical step is the 5.618 level, which lies at $166,754.
Why history still rhymes at $166,000
CryptoCon’s model might sound technical, but it is not new. The same Fibonacci structure has appeared in earlier Bitcoin cycles as well.
In 2013, Bitcoin peaked around $1,150, which was the 5.618 extension from its 2012 breakout. In 2017, the top near $20,000 landed just past the 4.618 level from the 2015 lows.
Even the 2021 cycle, which many called irregular, topped near $69000, almost exactly at the 3.618 extension of the 2018 bottom near $3,200.
These repeated alignments suggest that Fibonacci levels have acted like pressure points where Bitcoin either pauses or reverses.
This brings us back to today. From $15,500 to $30,362 was about a 95% gain. From there to $46, 831 was around 54%. Then to $71, 591 was another 53%. From $71,591 to $109,236 added roughly 52%.
These stages reflect how Bitcoin has climbed in well-defined bursts, often pulling back at each level before continuing upward. If the same spacing applies again, then a 52 percent rise from the last level puts the next target at $166,754, matching the 5.618 extension.
There are also non-technical factors that support this idea. The Bitcoin halving in April 2024 reduced the supply issued to miners, an event that has historically led to higher prices in the following year.
After the 2012 and 2016 halvings, Bitcoin rallied sharply over 12 to 18 months. We are now 16 months into that post-halving window.
The result is a market that is moving in line with past cycles, with both math and macro forces pointing to the same next level.
Macro moves and policy shifts
Previous Bitcoin cycles were largely driven by retail enthusiasm and loosely governed exchange behavior. But the current cycle is different. It is shaped as much by liquidity flows, macroeconomic policies, and political direction as it is by technical signals or on-chain patterns.
At the macro level, the U.S. Federal Reserve continues to hold interest rates in the range of 4.25-4.5%. Inflation has declined from its 2022 peak but remains sticky. Core inflation is still around 3%, above the Fed’s 2% target.
This has delayed any firm commitment to rate cuts. Economic data has shown signs of weakening, but the central bank remains cautious.
A key Consumer Price Index report is due in mid-August, with expectations of 2.9% for headline inflation and 3% for core.
If these numbers come in lower, markets may begin to price in a potential rate cut by the fourth quarter. But until then, policy remains tight, and markets are responding more to data than speculation.
On the regulatory side, the U.S. has started to signal a shift in tone. In July 2025, the GENIUS Act finally passed, offering a legal framework for stablecoins and defining digital asset classifications more clearly.
Around the same time, a pilot program called the Strategic Bitcoin Reserve was approved for funding, which would allow the federal government to hold Bitcoin as part of its broader asset portfolio.
Enforcement actions have also slowed, with the SEC pausing several cases. The direction now appears to be toward integration and regulation, not restriction.
ETF demand shows how strong that integration already is. BlackRock’s iShares Bitcoin Trust now holds around 740,000 BTC, with an estimated $85 billion in assets. It ranks among the largest ETFs ever launched.
Across all U.S. spot Bitcoin ETFs, total assets have reached nearly $150 billion. That represents roughly 6.5% of Bitcoin’s total market cap and gives institutions control over more than one in every fifteen Bitcoin currently in circulation.
All of this supports a backdrop where institutional demand can grow without friction, and that demand continues to rise.
Behavioral clues and what comes next
The $166,000 target drawn from CryptoCon’s Fibonacci model may appear purely structural, but recent observations from other analysts suggest the pace of movement could be influenced by behavioral and seasonal variables.
Crypto analyst Benjamin Cowen, in a recent tweet, highlighted a consistent seasonal trend observed in every prior post-halving year: Bitcoin posted gains in both July and August, followed by a correction in September and a bounce in October.
In all prior post-halving years (2013, 2017, 2021), #Bitcoin was green in July and August, then red in September.
So far this year we have a green July. If August is also green, we might get a seasonal drop in September before a bounce in October. pic.twitter.com/sH8aLRmJw7
The pattern appeared in 2013, 2017, and 2021. In each instance, a strong summer period gave way to a short-term pullback before the uptrend resumed.
So far in 2025, July has already closed with a 7.22% gain. If August continues higher, the trend could play out again with a modest decline in September.
Another crypto analyst, Axel, offered a contrasting view focused on market structure rather than seasonality. He tracked the harmonic mean of two metrics — NUPL and MVRV — which together reflect the average unrealized profit levels across holders.
https://twitter.com/AxelAdlerJr/status/1952264435403206656
In both March and December 2024, those metrics peaked at 1.95 and 1.99, respectively, just before market corrections. The latest reading stands at 1.73, forming a lower high.
Holders remain in profit, but many appear to be gradually reducing their risk exposure. The implication is that while the uptrend may continue, each new high could face stronger selling pressure.
Axel expects two more rallies before the market enters a slower phase marked by weaker demand and steadier profit-taking.
Taken together, the technical model still points to $166,000, supported by historical cycle behavior and ongoing ETF demand. However, near-term corrections and macroeconomic changes could influence how and when the market approaches that level.
There is never a certainty that events will unfold as analysts expect. Crypto markets are volatile, and momentum can shift quickly. Trade wisely and never invest more than you can afford to lose.
Disclosure: This article does not represent investment advice. The content and materials featured on this page are for educational purposes only.


 English (US) ·